


FXOpen
The Euro and British Pound traded lower this week against the Japanese Yen. Both EUR/JPY and GBP/JPY are currently correcting higher, but they are approaching important resistances.
Important Takeaways for EUR/JPY and GBP/JPY
- The Euro is currently struggling near the 128.80 and 129.00 resistances against the Japanese Yen.
- There is a major bearish trend line formed with resistance at 128.80 on the hourly chart of EUR/JPY.
- GBP/JPY declined recently and traded near the 144.25 support level.
- There is a crucial resistance formed on the upside near the 146.00 level.
EUR/JPY Technical Analysis
The Euro started a major downside move from 130.00 resistance area against the Japanese Yen. The EUR/JPY pair declined heavily and broke the 129.00 and 128.50 support levels.
The pair even traded below the 128.00 support level and settled below the 50 hourly simple moving average. It traded as low as 127.49 and later started an upside correction. Buyers pushed the pair above the 128.00 and 128.20 levels.
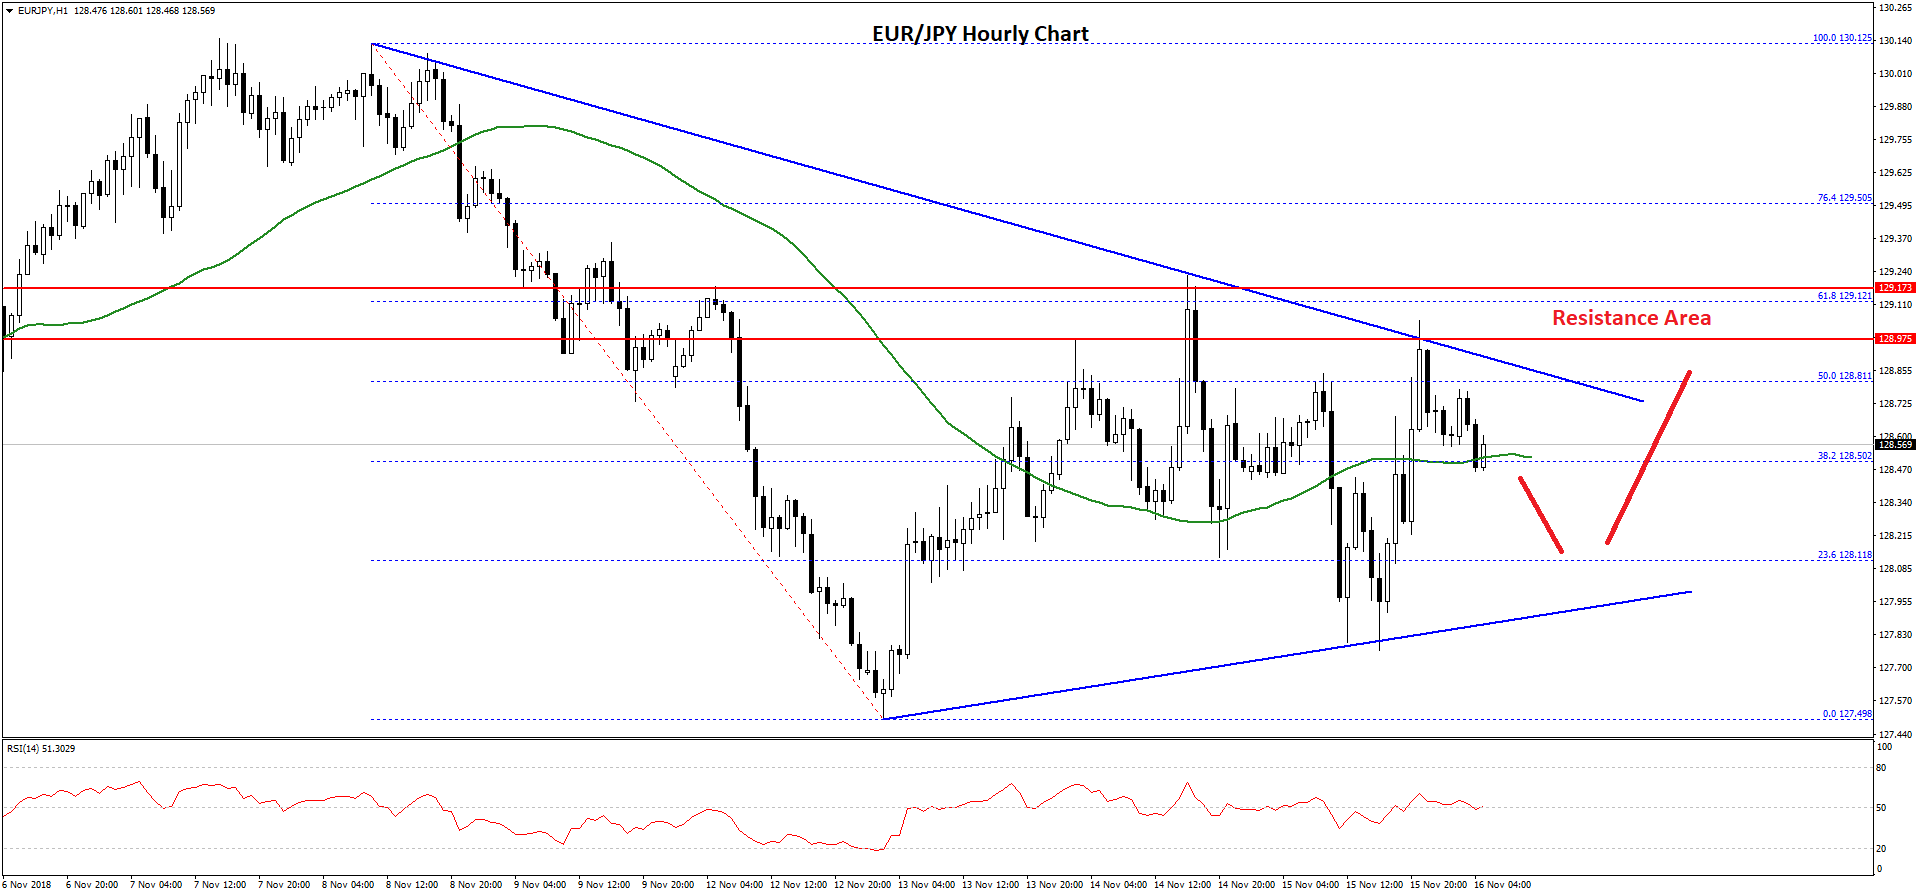
There was also a break above the 50% Fib retracement level of the last decline from the 130.12 high to 127.49 low. However, the pair faced a solid resistance near the 129.10 level.
Besides, the pair was rejected near the 61.8% Fib retracement level of the last decline from the 130.12 high to 127.49 low. More importantly, there is a major bearish trend line formed with resistance at 128.80 on the hourly chart of EUR/JPY.
At the moment, the pair is consolidating near the 128.50 level on FXOpen and the 50 hourly SMA. To climb higher, buyers need to break the 128.80 resistance, the same bearish trend line, and finally 129.00.
On the downside, an initial support is near the 128.35 level. There is also a connecting bullish trend line with support at 128.00 on the same chart. If there is a downside break below the trend line, the pair could revisit the 127.50 level.
Overall, the pair seems be facing a tough resistance near 128.80-129.00. It could either move above 129.00 or decline once again towards 127.50 in the near term.
GBP/JPY Technical Analysis
The British Pound was under a lot of pressure this week as it failed to move above the 149.00 resistance against the Japanese Yen. The GBP/JPY pair declined heavily and broke the 148.50, 147.50 and 147.00 support levels.
The decline was such that the pair also traded below the 145.00 support and settled below the 50 hourly simple moving average. It traded as low as 144.27 and later started a short term recovery. It tested the 23.6% Fib retracement level of the recent decline from the 148.72 high to 144.27 low.
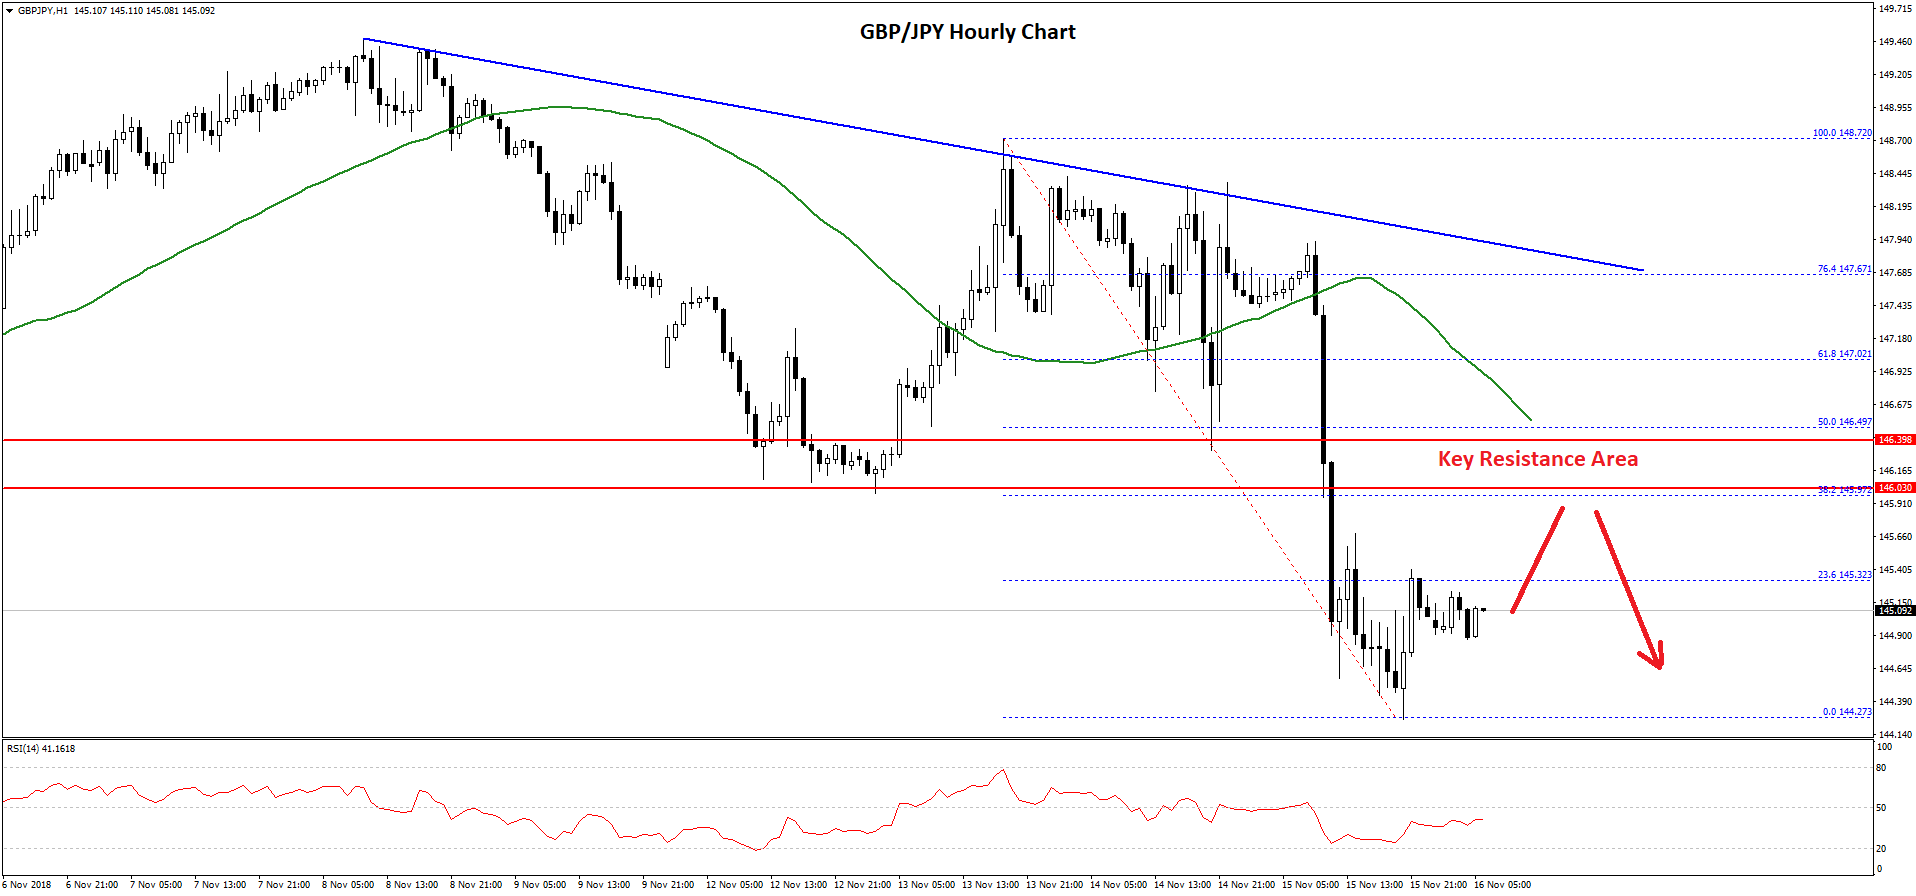
On the upside, there are many hurdles for buyers near the 146.00 level. The 146.00-146.50 zone was a support earlier, and now it is likely to act as a strong barrier for buyers.
Besides, the 50% Fib retracement level of the recent decline from the 148.72 high to 144.27 low is also near 146.50 to act as a resistance along with the 50 hourly SMA. If there is an upside break above the 146.50, the pair could trade above the 147.00 level.
Further above, there is a crucial bearish trend line with resistance at 147.60. Therefore, GBP/JPY is clearly facing a lot of hurdles near the 146.00, 146.50 and 147.00 levels. On the downside, an initial support is at 144.40, below which the pair could trade towards 144.00.
Trade over 50 forex markets 24 hours a day with FXOpen. Take advantage of low commissions, deep liquidity, and spreads from 0.0 pips. Open your FXOpen account now or learn more about trading forex with FXOpen.
This article represents the opinion of the Companies operating under the FXOpen brand only. It is not to be construed as an offer, solicitation, or recommendation with respect to products and services provided by the Companies operating under the FXOpen brand, nor is it to be considered financial advice.
Stay ahead of the market!
Subscribe now to our mailing list and receive the latest market news and insights delivered directly to your inbox.

Latest from Forex Analysis
Latest articles

Weekly Market Wrap With Gary Thomson: Nasdaq, EUR/USD, USD/CHF, Brent Crude Oil, Googl Shares
Get the latest scoop on the week's hottest headlines, all in one convenient video. Join Gary Thomson, the COO of FXOpen UK, as he breaks down the most significant news reports and shares his expert insights.
- Nasdaq Composite: Worst Session

Analysis of AUD/USD: Exchange Rate Falls to Early May Low
As indicated by the 4-hour AUD/USD chart today:
→ the rate fell below 0.652, a level last seen on May 2;
→ the RSI indicator dropped below 15, a level last seen during the panic over the spread of COVID-19

Analysis of AMZN Stock: Price at 1.5-Month Low
As shown in the AMZN chart, the stock price dropped below:
→ the psychological level of $180;
→ the mid-June interim low.
The last time AMZN traded below $180 was in early June.
Thus, AMZN has faced sell-offs, similar to other tech