


EUR/JPY and GBP/JPY Remain in Downtrend
FXOpen
The Euro and British Pound declined consistently this week against the Japanese Yen. Both EUR/JPY and GBP/JPY are following a major downtrend and they are likely to extend declines.
Important Takeaways for EUR/JPY and GBP/JPY
- The Euro started a major downside move from the 132.00 resistance area against the Japanese Yen.
- There is a major declining channel formed with resistance near 131.15 on the hourly chart of EUR/JPY.
- GBP/JPY also declined and settled below the 148.00 support area.
- A break below 146.00 may perhaps accelerate losses in GBP/JPY in the near term.
EUR/JPY Technical Analysis
After a decent uptrend, the Euro faced a strong selling interest near the 132.00 level against the Japanese Yen. The EUR/JPY pair started a major downward move and declined below the 131.50, 131.20 and 131.00 support levels.
The pair traded towards the 130.50 support area and formed a low at 130.60. At present, the pair is correcting higher and is trading near the 23.6% Fib retracement level of the last decline from the 131.95 high to 130.60 low.
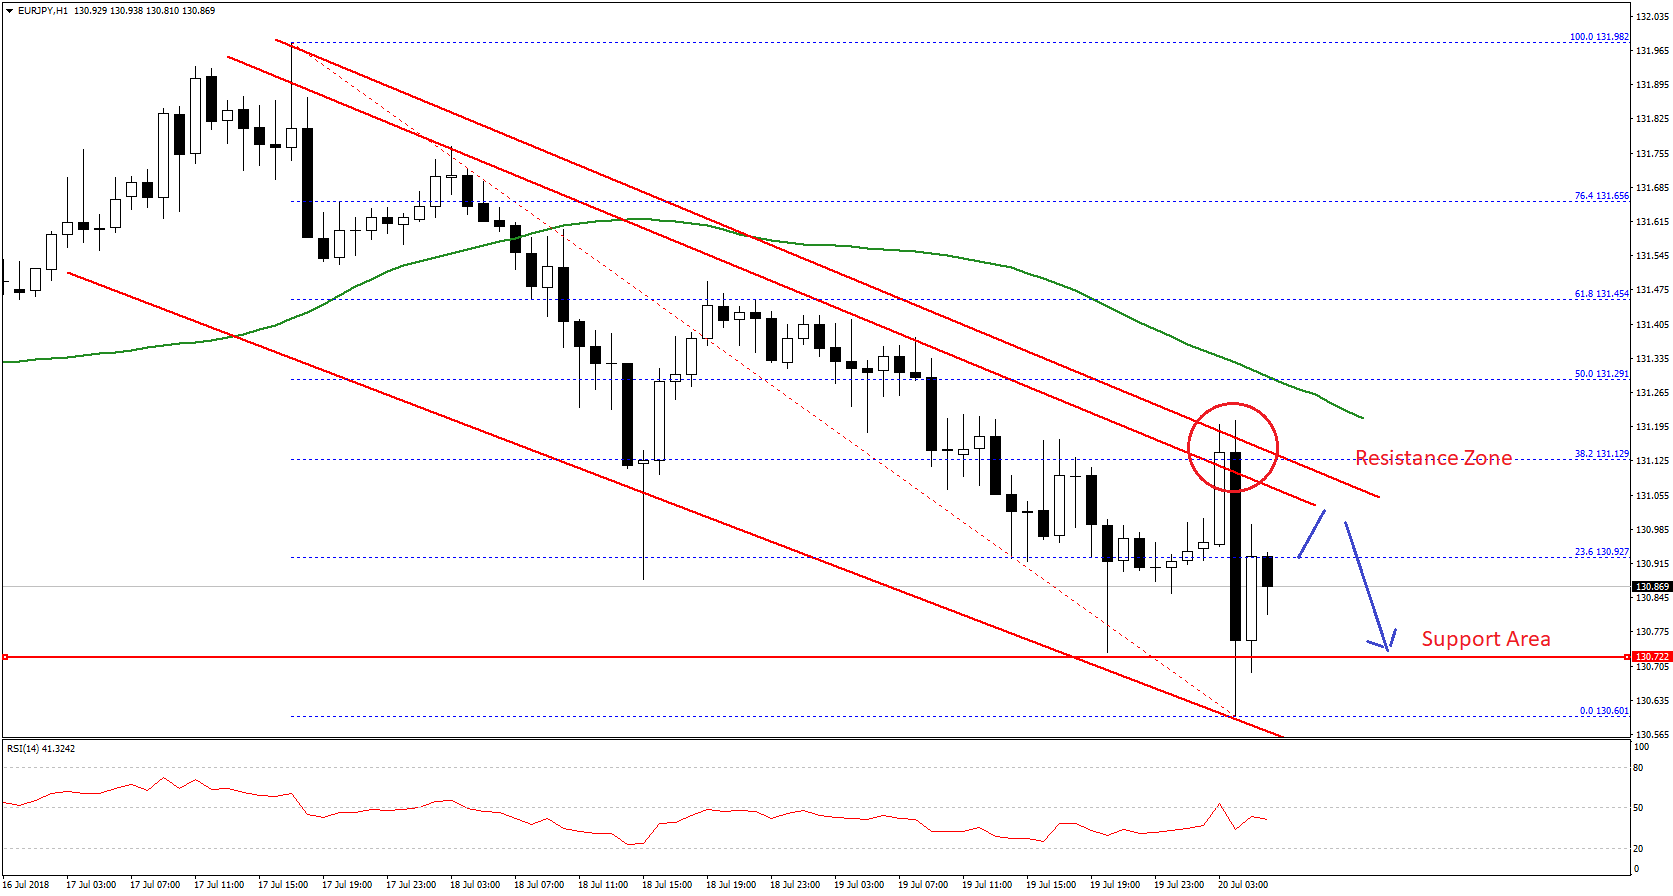
However, there is a crucial resistance formed near 131.10/20. More importantly, there is a major declining channel with resistance near 131.15 on the hourly chart.
Above the channel resistance, the 50 hourly simple moving average is positioned near the 131.20 level. Above this, the 50% Fib retracement level of the last decline from the 131.95 high to 130.60 low is the next resistance at 131.29.
Therefore, the pair has to break the channel resistance, the 50 hourly SMA, and finally the 131.30 resistance to start a fresh upward wave. If it fails to move above these resistances, there could be more losses towards the 130.60 and 130.50 support levels. The most important support is near 130.00, where buyers are likely to take a stand.
GBP/JPY Technical Analysis
The British Pound found also followed a similar path against the Japanese Yen. The GBP/JPY pair faced a major resistance near the 149.50-150.00 resistance area, resulting in a bearish reaction below the 149.00 level.
The pair declined and broke the 148.00 and 147.00 support levels. It tested the 146.00 level and formed a low at 145.98. At the moment, the pair is consolidating losses above the 146.00 level.
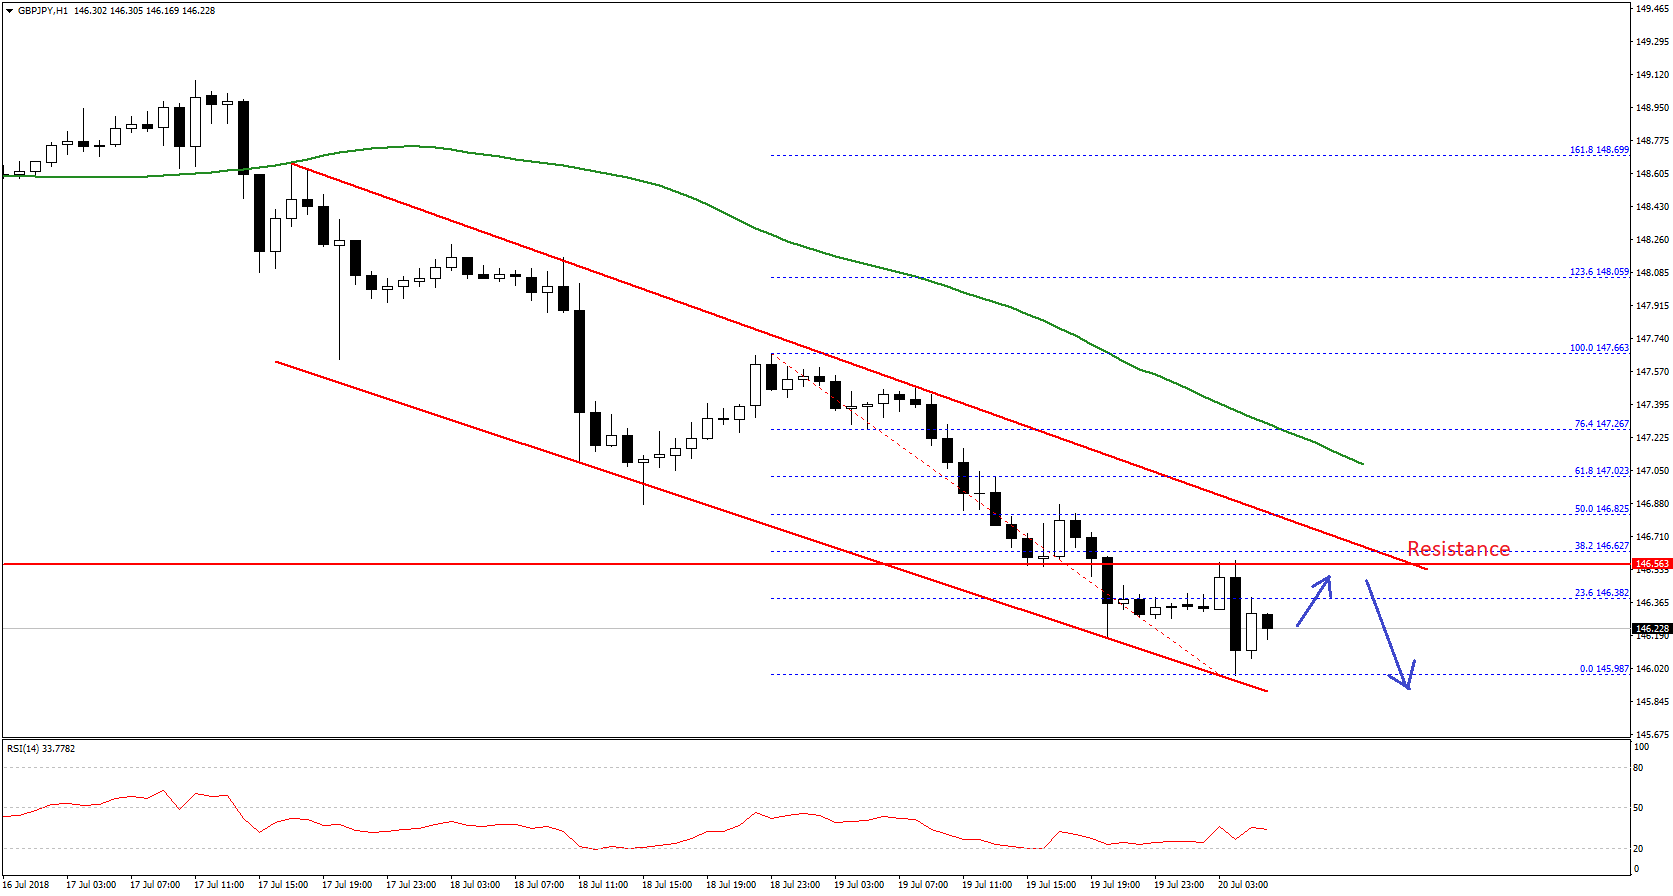
An initial resistance is near the 23.6% Fib retracement level of the last decline from the 147.66 high to 145.98 low. Moreover, there is a significant declining channel in place with resistance near 146.65.
Overall, it seems like there is a major resistance forming near 146.55/65, which coincides with the 38.2% Fib retracement level of the last decline from the 147.66 high to 145.98 low. A break above the channel resistance may perhaps push the pair towards the next resistance near 147.00 and the 50 hourly SMA.
Above 147.00, the pair will most likely resume its upside move towards the 148.00 and 148.50 levels. If the pair fails to move above 146.65 and 147.00, it could extend declines below the 146.00 level. The next major support below 146.00 is sitting at 145.40.
Today in Japan, the National Consumer Price Index for June 2018 was released by the Statistics Bureau. The market was looking for a rise of 0.8% in the CPI compared with the same month a year ago.
However, the actual result was below the forecast, the CPI increased 0.7%, similar to the last reading. The National CPI Ex Food and Energy increased 0.2% in June 2018 (YoY), whereas the market was looking for a 0.4% rise, and the last reading was +0.3%.
Trade over 50 forex markets 24 hours a day with FXOpen. Take advantage of low commissions, deep liquidity, and spreads from 0.0 pips (additional fees may apply). Open your FXOpen account now or learn more about trading forex with FXOpen.
This article represents the opinion of the Companies operating under the FXOpen brand only. It is not to be construed as an offer, solicitation, or recommendation with respect to products and services provided by the Companies operating under the FXOpen brand, nor is it to be considered financial advice.
Stay ahead of the market!
Subscribe now to our mailing list and receive the latest market news and insights delivered directly to your inbox.


Latest articles

US Dollar Strengthens Amid Equity Market Weakness and Hawkish Fed Rhetoric
The US dollar continues to hold firm near multi-year highs as sentiment across equity markets deteriorates and investors increasingly expect the Federal Reserve to maintain a restrictive monetary policy stance for longer. The US economy remains resilient, while inflation risks

Bitcoin: Corrective Channel Broken as Traders Turn More Active
Bitcoin has come under the influence of several factors simultaneously. The wave of selling at the beginning of June was linked to Strategy's first disclosed Bitcoin sale in several years, a prolonged series of outflows from spot ETFs, and a

DAX 40: consolidation amid technology sell-off
A wave of selling in the technology sector that emerged earlier this week has weighed on European equities. The trigger was investor concern over the profitability of large-scale debt-funded investments by major US tech companies in AI infrastructure. The Nasdaq