


EUR/JPY and GBP/JPY Remain in Uptrend
FXOpen
The Euro and British Pound are following a nice uptrend against the Japanese Yen. Both EUR/JPY and GBP/JPY remain supported on dips and they could continue to move higher.
Important Takeaways for EUR/JPY and GBP/JPY
- The Euro broke the 130.50 resistance and tested 131.00 recently against the Japanese Yen.
- There is a major ascending channel in place with support at 130.20 on the hourly chart of EUR/JPY.
- GBP/JPY settled above the 145.80 and 146.00 resistance levels.
- There is a bullish trend line formed with support at 146.20 on the hourly chart.
EUR/JPY Technical Analysis
The Euro formed a decent bottom near the 127.00 level and started an upward move against the Japanese Yen. The EUR/JPY pair followed a nice bullish path and broke the 128.50 and 130.00 resistance levels.
During the upside move, the pair broke a key resistance area near 129.80-130.00, which opened the doors for more gains and the pair settled above the 50 hourly simple moving average.
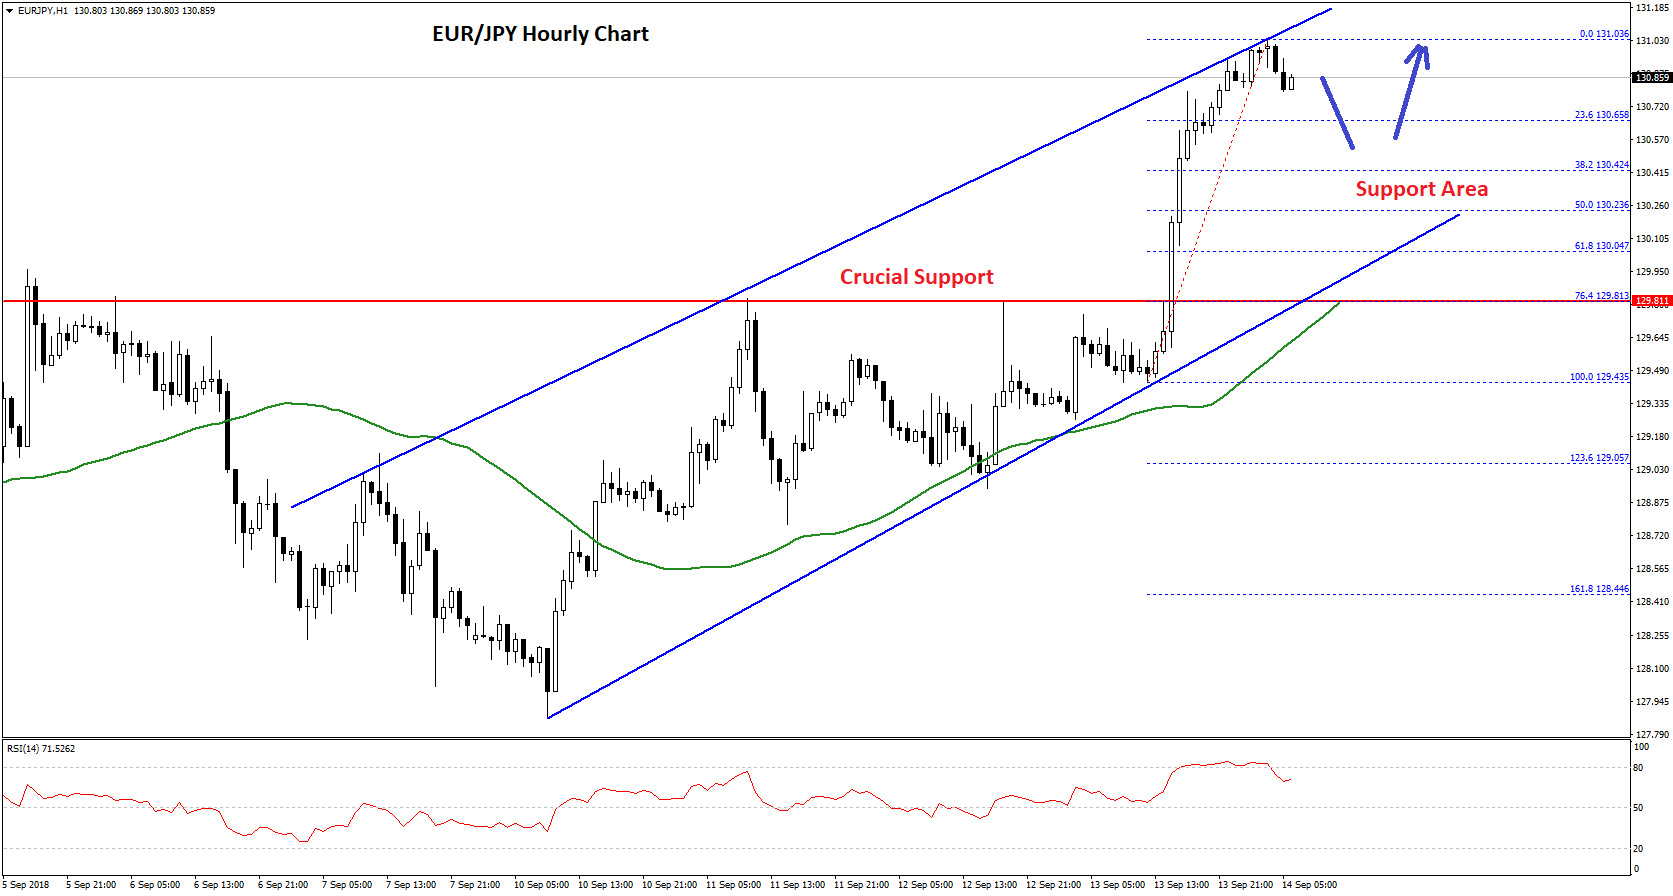
A new weekly high was formed at 131.03 and it seems like the pair is following a major ascending channel in place with support at 130.20 on the hourly chart. At the moment, the pair is consolidating gains below the 131.00 level.
An initial support is near the 23.6% Fib retracement level of the last wave from the 129.43 low to 131.03 high. Below 130.60, the next major support for buyers is near the 130.25 level, which is close to the channel support.
Moreover, the 50% Fib retracement level of the last wave from the 129.43 low to 131.03 high is also near 130.26. Therefore, dips from the current levels are likely to find support near the 130.60 or 130.20 levels.
On the upside, a proper close above the 131.00 resistance could clear the path for buyers to push the pair further higher towards the 132.00 level. Any further gains could lead the pair towards the 132.50 level.
GBP/JPY Technical Analysis
The British Pound also followed a bullish path from the 141.20 swing low against the Japanese Yen. The GBP/JPY pair climbed higher and broke many resistances such as 142.50, 144.00 and 145.90.
During the rise, the pair succeeded in settling above a crucial resistance at 145.90-146.00, which helped buyers to gain control. The pair traded above the 146.50 level and settled above the 50 hourly simple moving average.
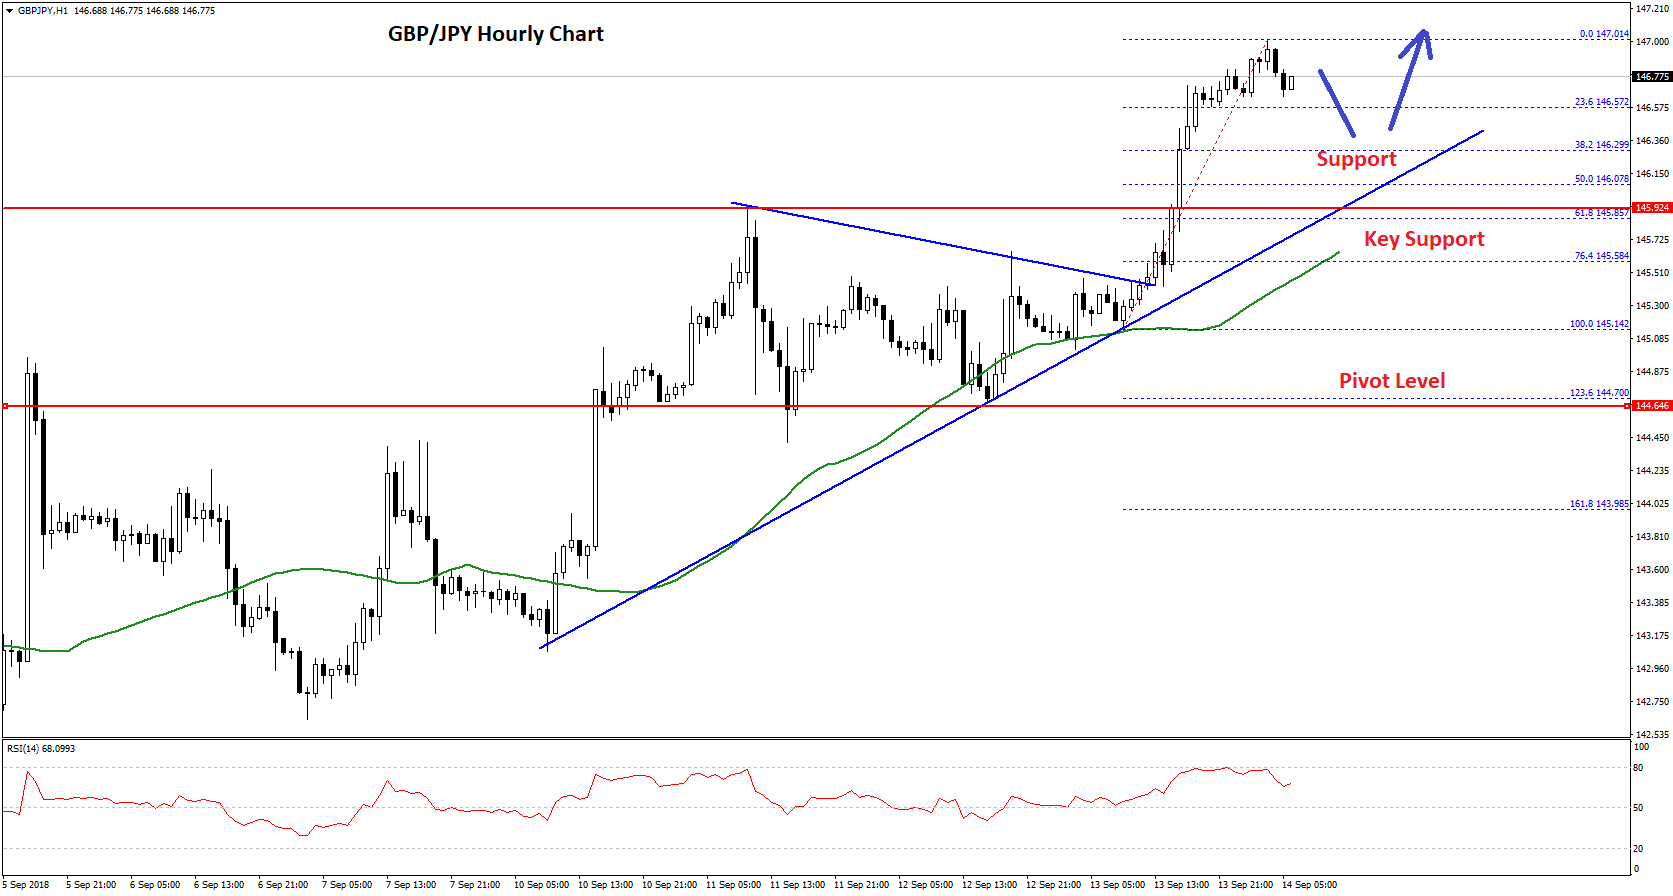
The pair traded as high as 147.01 and it is currently correcting lower. An initial support on the downside is near the 23.6% Fib retracement level of the last leg from the 145.14 low to 147.01 high.
If the pair breaks the 146.50 support, there could be an extended correction towards the 146.00 support area. There is also a bullish trend line formed with support at 146.20 on the hourly chart.
Above the trend line support, the 50% Fib retracement level of the last leg from the 145.14 low to 147.01 high is at 146.07. Moreover, the previous key resistance at 145.90 is also a major support.
Therefore, if the pair continues to correct lower, it could find a strong support near the 146.00 area. On the upside, a successful hourly close above 147.00 may well clear the path for more gains towards the 148.00 level in the near term.
Trade over 50 forex markets 24 hours a day with FXOpen. Take advantage of low commissions, deep liquidity, and spreads from 0.0 pips (additional fees may apply). Open your FXOpen account now or learn more about trading forex with FXOpen.
This article represents the opinion of the Companies operating under the FXOpen brand only. It is not to be construed as an offer, solicitation, or recommendation with respect to products and services provided by the Companies operating under the FXOpen brand, nor is it to be considered financial advice.
Stay ahead of the market!
Subscribe now to our mailing list and receive the latest market news and insights delivered directly to your inbox.


Latest articles

DAX 40: consolidation amid technology sell-off
A wave of selling in the technology sector that emerged earlier this week has weighed on European equities. The trigger was investor concern over the profitability of large-scale debt-funded investments by major US tech companies in AI infrastructure. The Nasdaq

Euro Hits Fresh Yearly Lows Amid Dovish ECB Signals
The euro remains under pressure following weak macroeconomic data from the euro area and fresh signals that the European Central Bank is prepared to maintain a more accommodative monetary policy stance. Data released yesterday pointed to a deterioration in business

Pound at Key Levels: Markets Assess Impact of Political Uncertainty in the UK
The British pound remains under pressure following increased political uncertainty in the United Kingdom triggered by the Prime Minister’s resignation. Investors are assessing potential shifts in the political and economic policy outlook after the head of government stepped down,