


EUR/JPY and GBP/JPY: Upsides Could Face Hurdles
FXOpen
The Euro and British Pound traded lower this week below key supports against the Japanese Yen. EUR/JPY is showing a few positive signs, while GBP/JPY is trading in a bearish zone.
Important Takeaways for EUR/JPY and GBP/JPY
- The Euro declined heavily below the 125.80 and 125.00 support levels against the Japanese Yen.
- Recently, there was a break above a key bearish trend line with resistance near 124.20 on the hourly chart of EUR/JPY.
- GBP/JPY broke a major bullish trend line with support at 145.70 on the hourly chart.
- The pair is currently recovering, but it is likely to face a lot of hurdles near the 145.40 level.
EUR/JPY Technical Analysis
There was a strong rejection near the 126.80 and 127.00 resistance levels, the Euro declined heavily against the Japanese Yen. The EUR/JPY pair started a strong downward move and traded below the 125.80 and 125.00 support levels.
There was even a break below the 124.00 level and the 50 hourly simple moving average. A new weekly low was formed at 123.65 on FXOpen. Later, there was a fresh rebound and the pair moved above the 124.00 level.
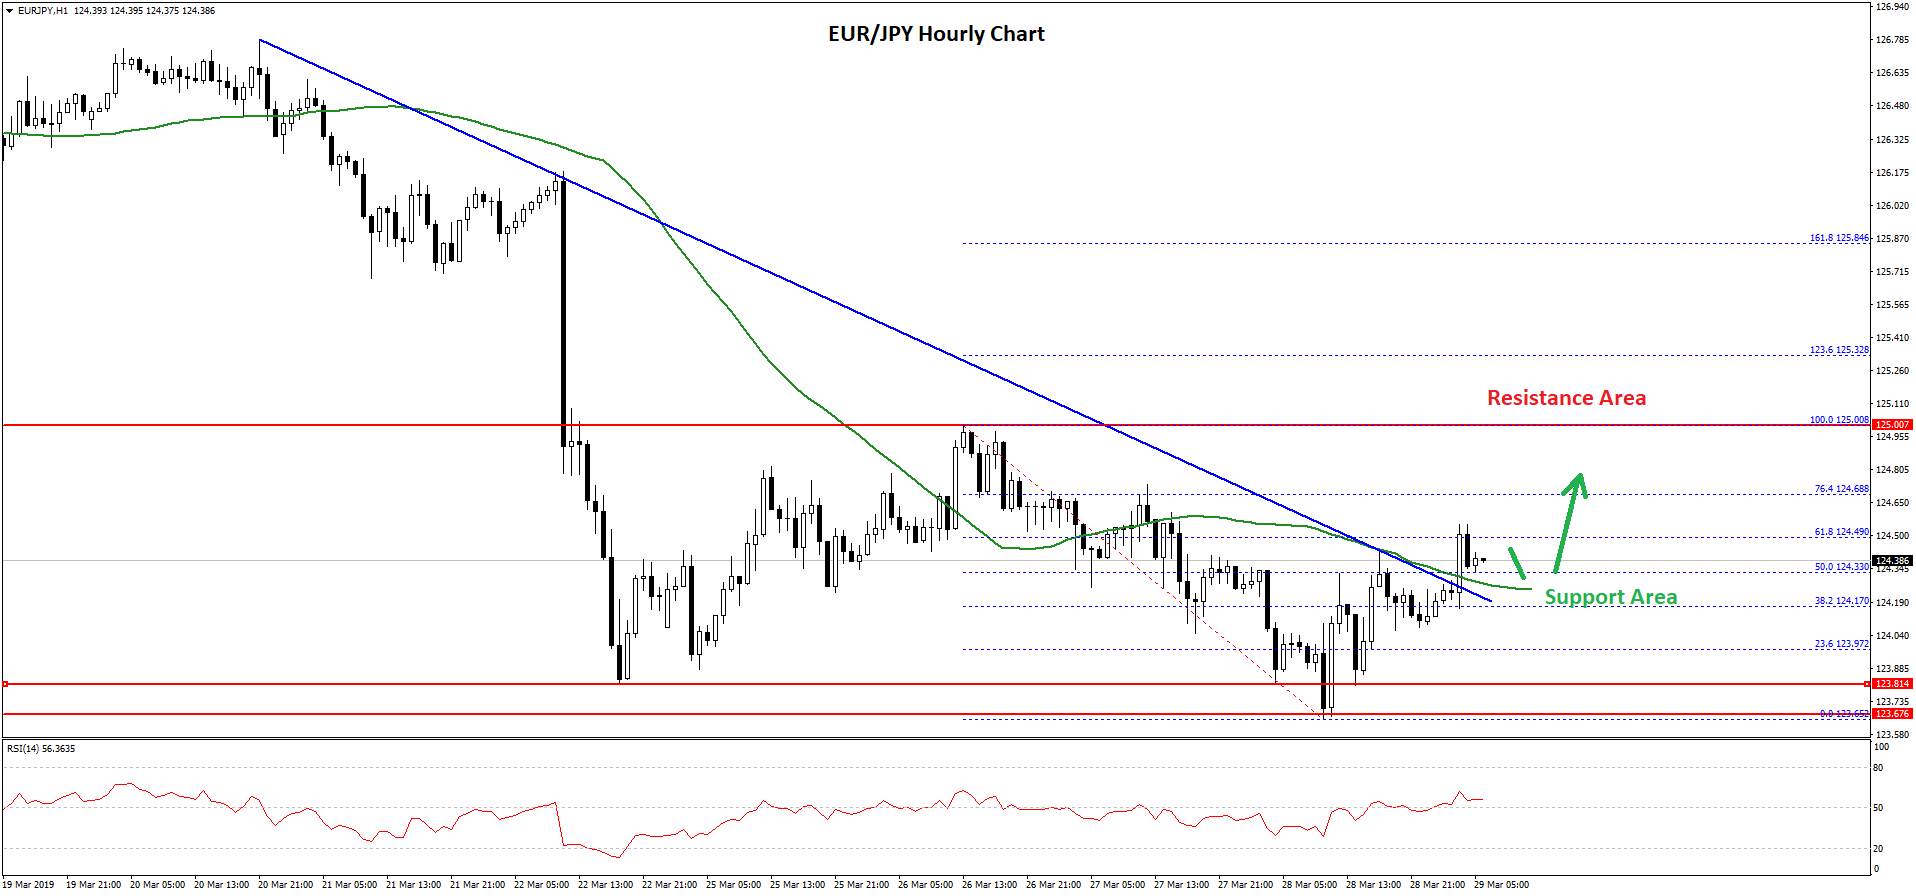
There was there was a break above a key bearish trend line with resistance near 124.20 on the hourly chart of EUR/JPY. Moreover, there was a close above 124.10 and the 50 hourly simple moving average.
There was a break above the 50% Fib retracement level of the last decline from the 125.00 high to 123.65 low. However, the pair faced a strong resistance near the 124.50 level and the 61.8% Fib retracement level of the last decline from the 125.00 high to 123.65 low.
In the short term, there could be a minor decline, but the 124.20 and 124.10 levels are likely to act as supports. Below 124.00, the pair may move back in a bearish zone.
On the upside, the pair needs to surpass the 124.50 and 124.60 resistance levels to retain momentum. The next key resistance is near 125.00, where sellers are likely to emerge.
GBP/JPY Technical Analysis
After a decent recovery from the 144.20 support area, the British Pound faced a strong resistance near the 146.50 level against the Japanese Yen. The GBP/JPY pair started a solid decline and broke the 146.00 and 145.50 support level.
Moreover, the pair broke a major bullish trend line with support at 145.70 on the hourly chart. There was even a close below the 145.00 level and the 50 hourly simple moving average.
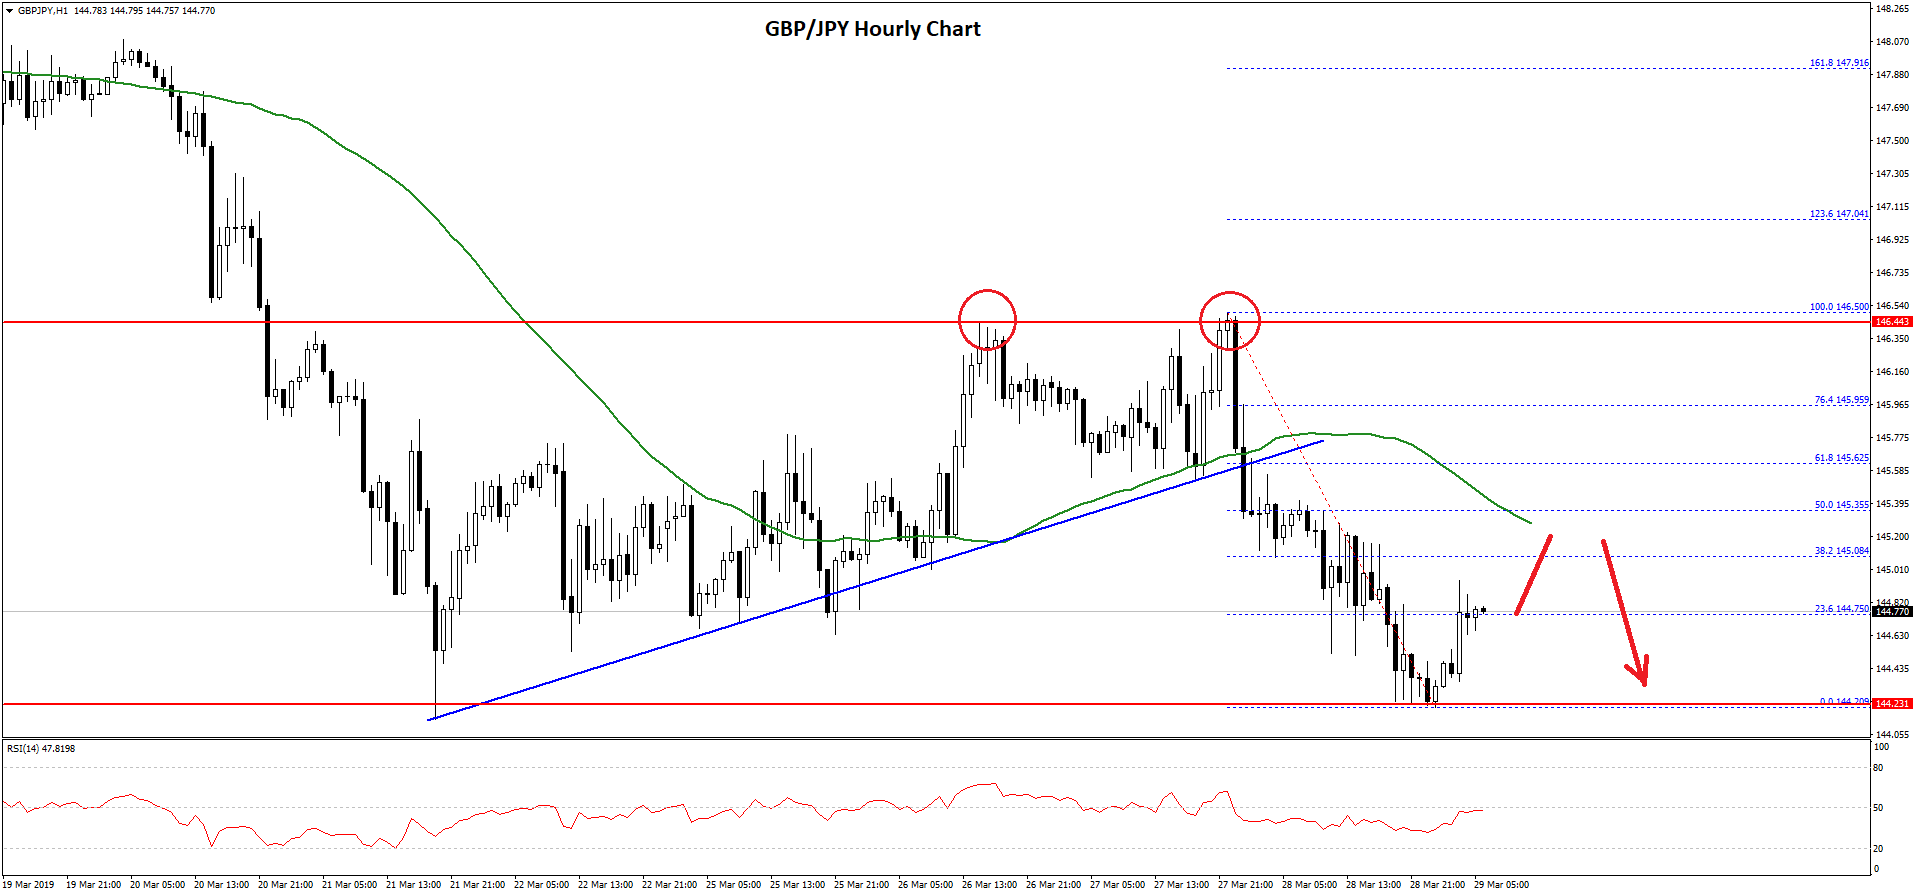
The pair tested the 144.20 level and it is currently correcting higher. It tested the 23.6% Fib retracement level of the last decline from the 146.50 high to 144.20 low. However, there are many hurdles for buyers on the upside near the 145.00 and 145.20 levels.
Moreover, the 50 hourly simple moving average is also positioned near the 145.20 level. The next key resistance is near the 145.30 level and the 50% Fib retracement level of the last decline from the 146.50 high to 144.20 low.
Therefore, if the GBP/JPY pair corrects higher in the short term, it could face a lot of barriers near the 145.00, 145.20 and 145.30 levels. On the downside, an initial support is near the 144.20 level, below which the pair could decline towards the 144.00 and 143.80 levels.
Trade over 50 forex markets 24 hours a day with FXOpen. Take advantage of low commissions, deep liquidity, and spreads from 0.0 pips (additional fees may apply). Open your FXOpen account now or learn more about trading forex with FXOpen.
This article represents the opinion of the Companies operating under the FXOpen brand only. It is not to be construed as an offer, solicitation, or recommendation with respect to products and services provided by the Companies operating under the FXOpen brand, nor is it to be considered financial advice.
Stay ahead of the market!
Subscribe now to our mailing list and receive the latest market news and insights delivered directly to your inbox.


Latest articles

USD/JPY and USD/CHF Near Key Levels: The Dollar Supported by the Fed
The US dollar continues to trend upwards following the Federal Reserve meeting, drawing support from the regulator’s moderately hawkish stance and comments by Jerome Powell. Markets interpret the Fed’s rhetoric as a signal that restrictive policy is likely

EUR/USD and GBP/USD consolidate ahead of the Fed decision
European currencies are showing subdued dynamics, entering a consolidation phase following their previous advance. Earlier, EUR/USD and GBP/USD broke out of their ranges and strengthened; however, the subsequent correction has led both pairs to retest the previously breached

Meta: V-Shaped Recovery Meets Heavy Volume Resistance
The movement in Meta Platforms shares is being driven by two competing narratives. On one hand, advertising revenue is benefiting from AI-based tools: the Advantage+ platform continues to support strong advertiser demand, and the analyst consensus for Q1 2026 revenue