


FXOpen
The Euro made a nice upside move and climbed above 129.00 against the Japanese Yen. The British Pound is currently holding an important support at 144.60, and GBP/JPY could bounce back.
Important Takeaways for EUR/JPY and GBP/JPY
- The Euro gained momentum recently and traded above the 128.80 resistance against the Japanese Yen.
- There is a major connecting resistance trend line in place at 129.30 on the hourly chart of EUR/JPY.
- GBP/JPY is consolidating above two major bullish trend lines with support near 144.60 on the hourly chart.
- The pair must break the 145.15 resistance to start a decent upward move.
EUR/JPY Technical Analysis
The Euro found a decent buying interest near the 128.30 and 128.40 support levels against the Japanese Yen. The EUR/JPY pair started an upside wave and traded above the 128.80 and 129.00 resistance levels.
The pair gained strength and settled above the 129.00 barrier and the 50 hourly simple moving average. It traded close to the 129.30 level where it faced sellers. A high was formed at 129.29 on FXOpen and later the pair corrected lower.
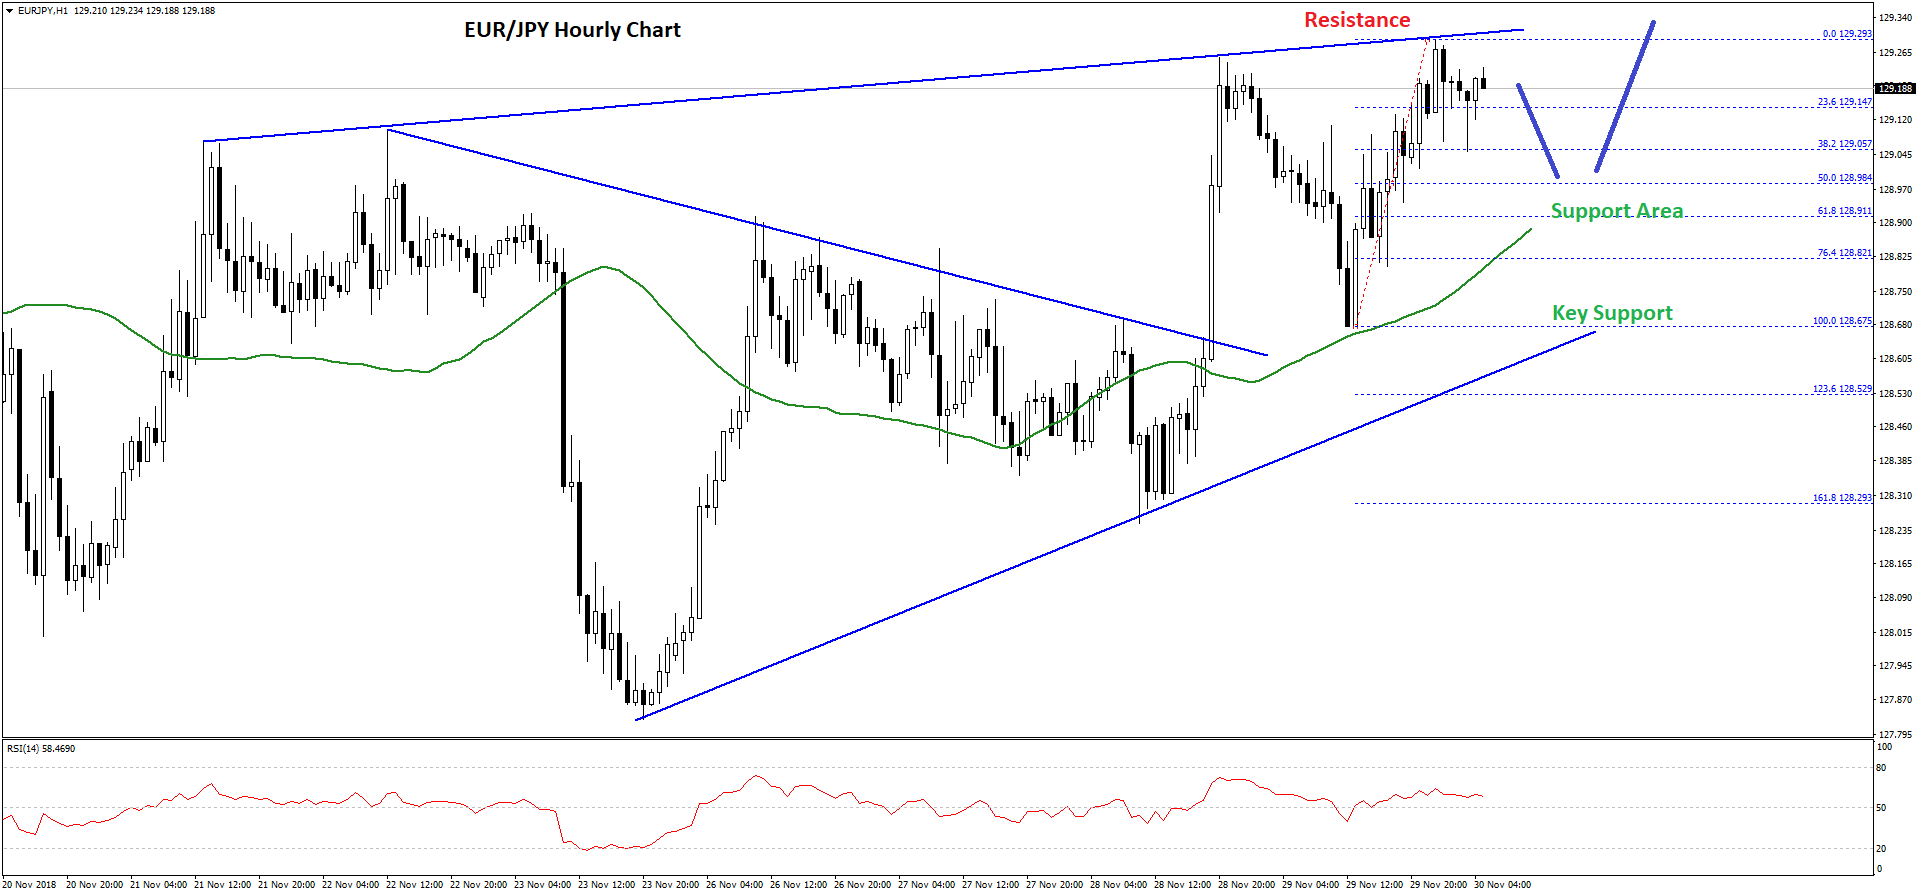
It declined below the 23.6% Fib retracement level of the last wave from the 128.67 low to 129.29 high. However, there are many supports on the downside near the 129.00 and 128.90 levels.
The 129.00 support coincides with the 50% Fib retracement level of the last wave from the 128.67 low to 129.29 high. Below 129.00, the 50 hourly SMA is positioned near the 128.90 level. Finally, there is a solid bullish trend line in place with support at 128.70 on the hourly chart.
On the upside, the pair must break the 129.30 and 129.40 resistance levels. There is also a major connecting resistance trend line in place at 129.30 on the same chart.
Therefore, a successful close above the trend line resistance and 129.40 could open the doors for more gains towards the 129.80 and 130.00 levels in the near term.
GBP/JPY Technical Analysis
The British Pound struggled to break the 145.80 and 146.00 resistance levels on many occasions against the Japanese Yen. The GBP/JPY pair recently formed a high near the 145.83 level and declined heavily.
The pair dropped below the 145.50 and 145.00 support levels. The decline was such that there was a close below the 145.00 handle and the 50 hourly simple moving average. It traded as low as 144.51 and later started consolidating losses.
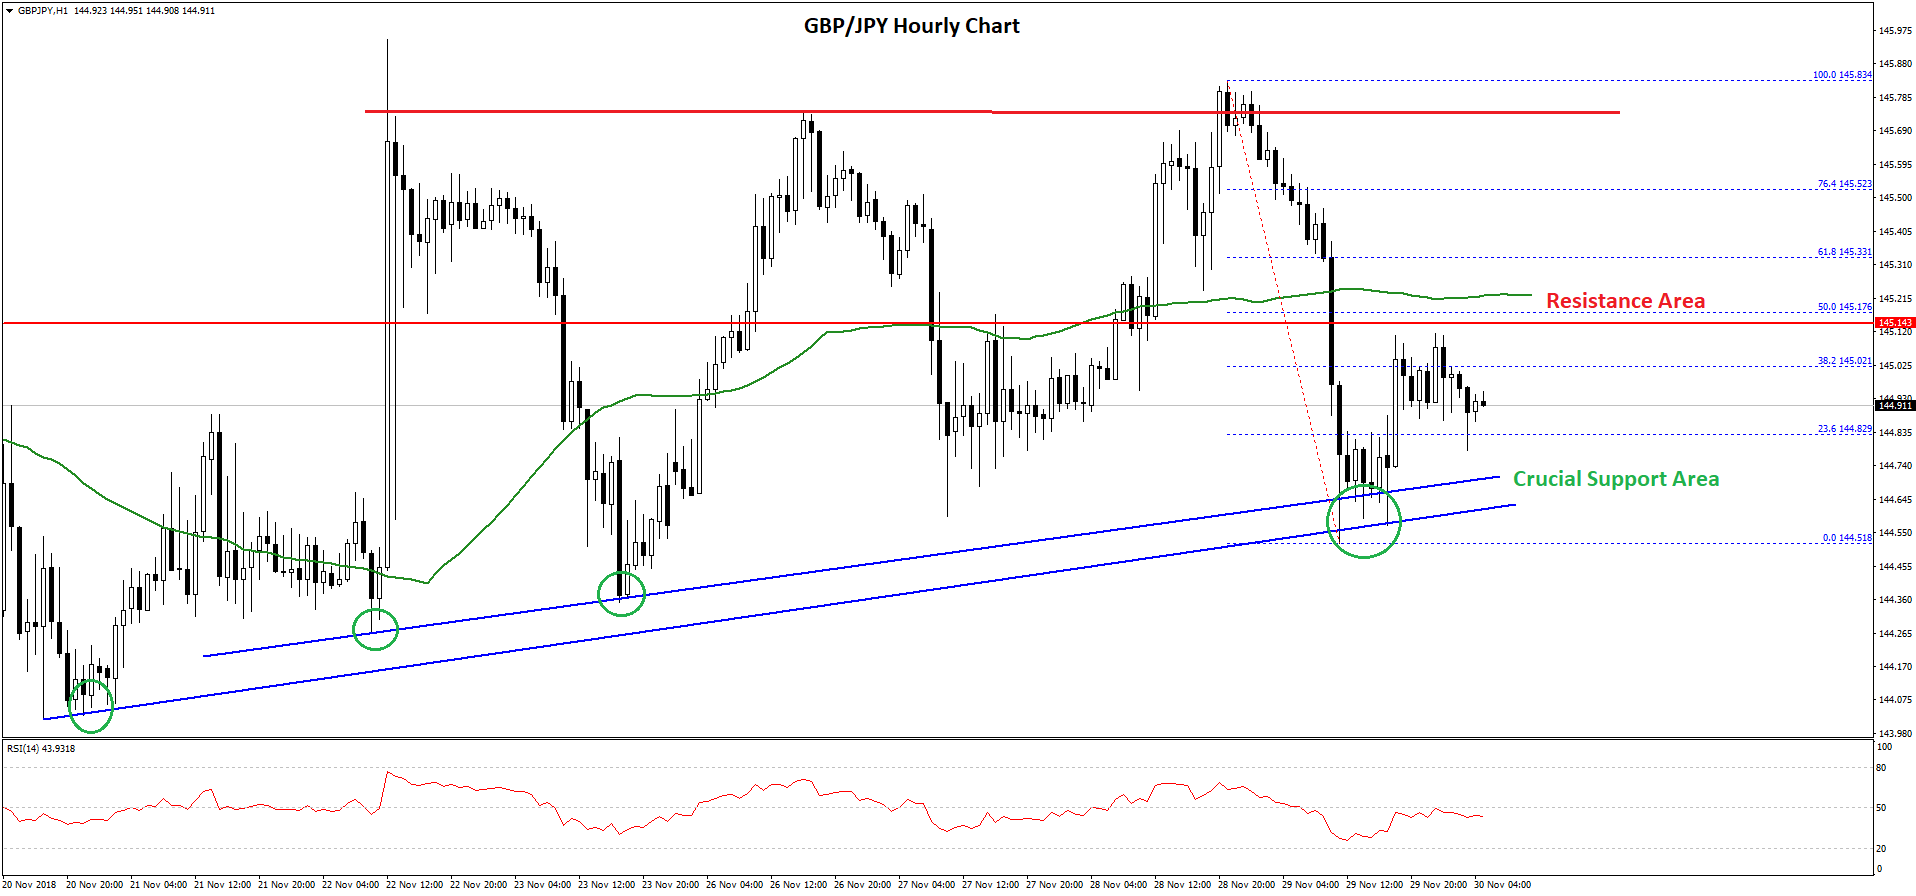
It corrected above the 23.6% Fib retracement level of the recent drop from the 145.83 high to 144.51 low. However, there is a strong resistance formed near the 145.15 level and the 50 hourly SMA.
The stated 145.15 resistance is also near the 50% Fib retracement level of the recent drop from the 145.83 high to 144.51 low. Therefore, a close above the 145.15 and 145.20 levels may push the price back in a bullish zone. The next hurdles for buyers are near the 145.80 and 146.00 levels.
On the downside, there is a decent support formed near the 144.75 and 144.60 levels. More importantly, there are two major bullish trend lines in place with support near 144.60 on the hourly chart. If there is a close below trend lines, GBP/JPY could decline towards 144.00 or 143.60.
Trade over 50 forex markets 24 hours a day with FXOpen. Take advantage of low commissions, deep liquidity, and spreads from 0.0 pips. Open your FXOpen account now or learn more about trading forex with FXOpen.
This article represents the opinion of the Companies operating under the FXOpen brand only. It is not to be construed as an offer, solicitation, or recommendation with respect to products and services provided by the Companies operating under the FXOpen brand, nor is it to be considered financial advice.
Stay ahead of the market!
Subscribe now to our mailing list and receive the latest market news and insights delivered directly to your inbox.

Latest from Forex Analysis
Latest articles

Weekly Market Wrap With Gary Thomson: Nasdaq, EUR/USD, USD/CHF, Brent Crude Oil, Googl Shares
Get the latest scoop on the week's hottest headlines, all in one convenient video. Join Gary Thomson, the COO of FXOpen UK, as he breaks down the most significant news reports and shares his expert insights.
- Nasdaq Composite: Worst Session

Analysis of AUD/USD: Exchange Rate Falls to Early May Low
As indicated by the 4-hour AUD/USD chart today:
→ the rate fell below 0.652, a level last seen on May 2;
→ the RSI indicator dropped below 15, a level last seen during the panic over the spread of COVID-19

Analysis of AMZN Stock: Price at 1.5-Month Low
As shown in the AMZN chart, the stock price dropped below:
→ the psychological level of $180;
→ the mid-June interim low.
The last time AMZN traded below $180 was in early June.
Thus, AMZN has faced sell-offs, similar to other tech