


EUR/USD Aims Higher While USD/JPY Faces Hurdles
FXOpen

EUR/USD found support near 1.1665 and started an upside correction. USD/JPY is facing a major resistance near 109.85, followed by 110.00.
Important Takeaways for EUR/USD and USD/JPY
· The Euro started an upside correction above 1.1700 and 1.1720.
· There was a break above a key bearish trend line with resistance near 1.1735 on the hourly chart of EUR/USD.
· USD/JPY started a fresh increase, but it is struggling to clear the 110.00 resistance.
· There is a major bullish trend line forming with support near 109.60 on the hourly chart.
EUR/USD Technical Analysis
This past week, the Euro saw a major decline below 1.1800 against the US Dollar. The EUR/USD pair broke the 1.1750 support zone to move into a bearish zone.
The pair settled below the 1.1750 level and the 50 hourly simple moving average. It even broke the 1.1700 support level and traded as low as 1.1663 on FXOpen. It is now correcting higher above the 1.1700 resistance level.
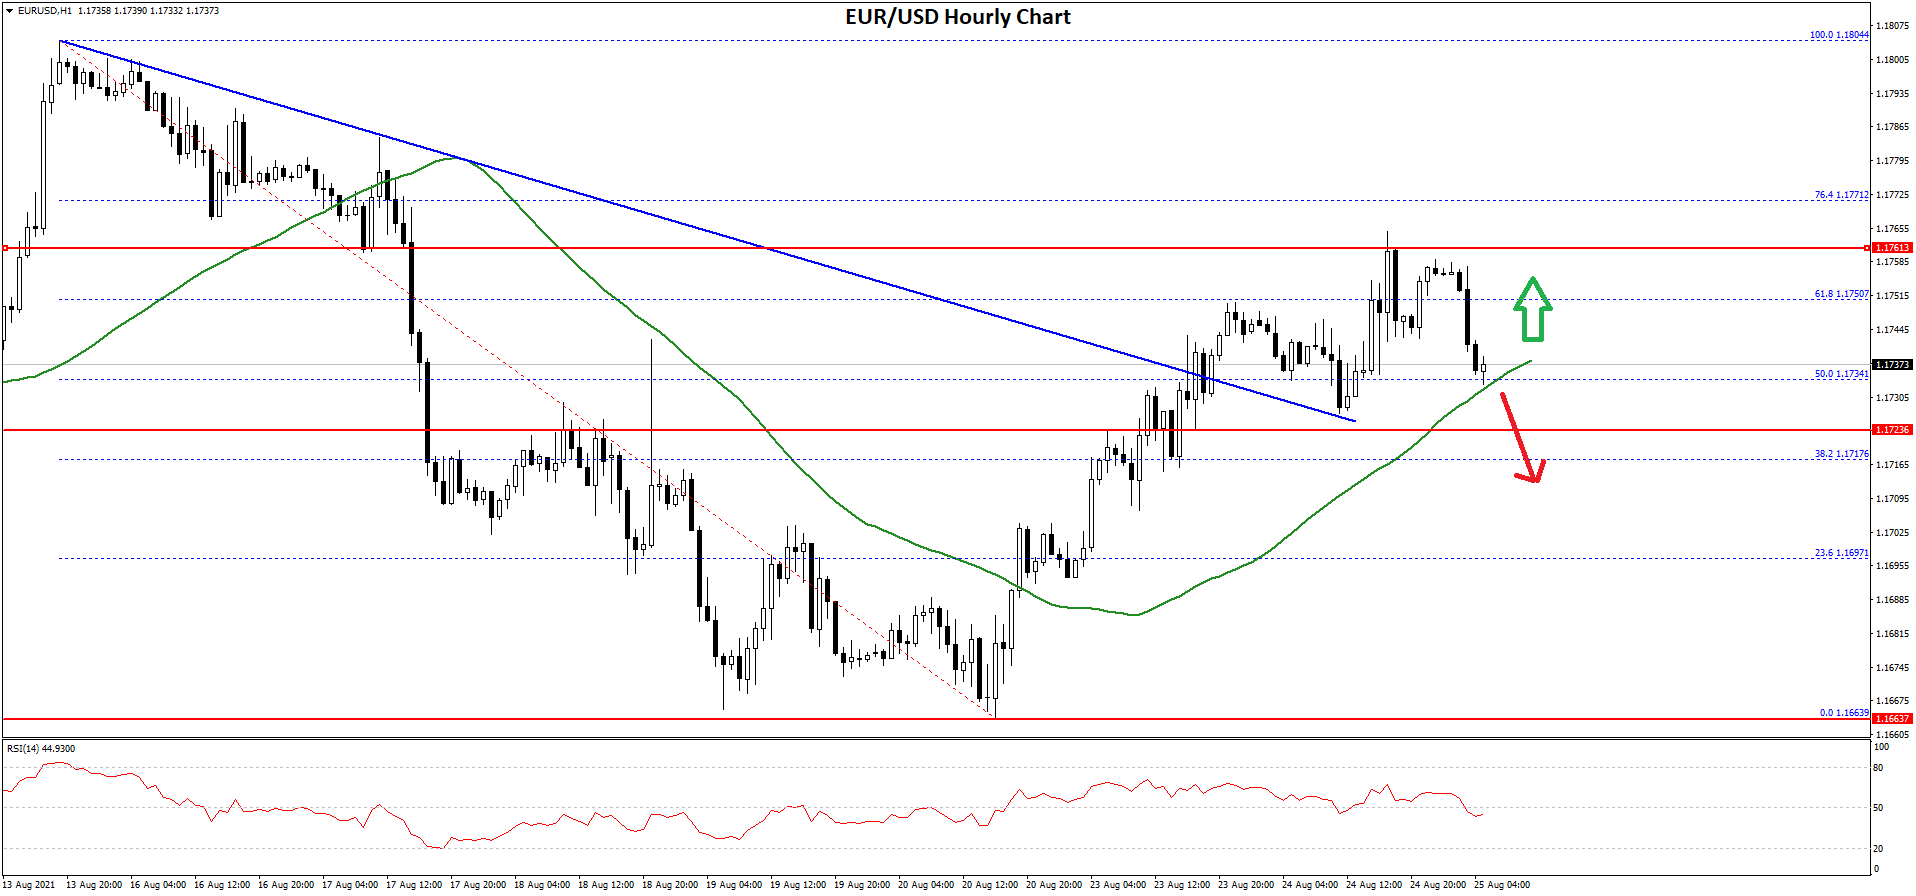
There was a break above the 50% Fib retracement level of the key decline from the 1.1804 swing high to 1.1663 low. There was also a break above a key bearish trend line with resistance near 1.1735 on the hourly chart of EUR/USD.
The pair is now consolidating above 1.1730 and the 50 hourly simple moving average. An immediate resistance is near the 1.1760 level. The first key resistance is near the 1.1770 level. It is near the 76.4% Fib retracement level of the key decline from the 1.1804 swing high to 1.1663 low.
The main resistance is near the 1.1800 level. A close above 1.1800 could open the doors for a steady increase towards 1.1850. If there is no break above 1.1760, the pair might continue to move down below 1.1720.
An intermediate support is near the 1.1700 level. The next major support is near the 1.1665 level, below which the pair could drop towards the 1.1600 support in the near term.
USD/JPY Technical Analysis
The US Dollar started a fresh increase above the 109.80 resistance against the Japanese Yen. The USD/JPY pair broke the 110.00 zone, but there was no upside continuation.
The last swing high was formed near 110.14 before the pair corrected lower. There was a drop below the 109.80 level and the 50 hourly simple moving average. A low is formed near 109.41 and the pair is now rising.
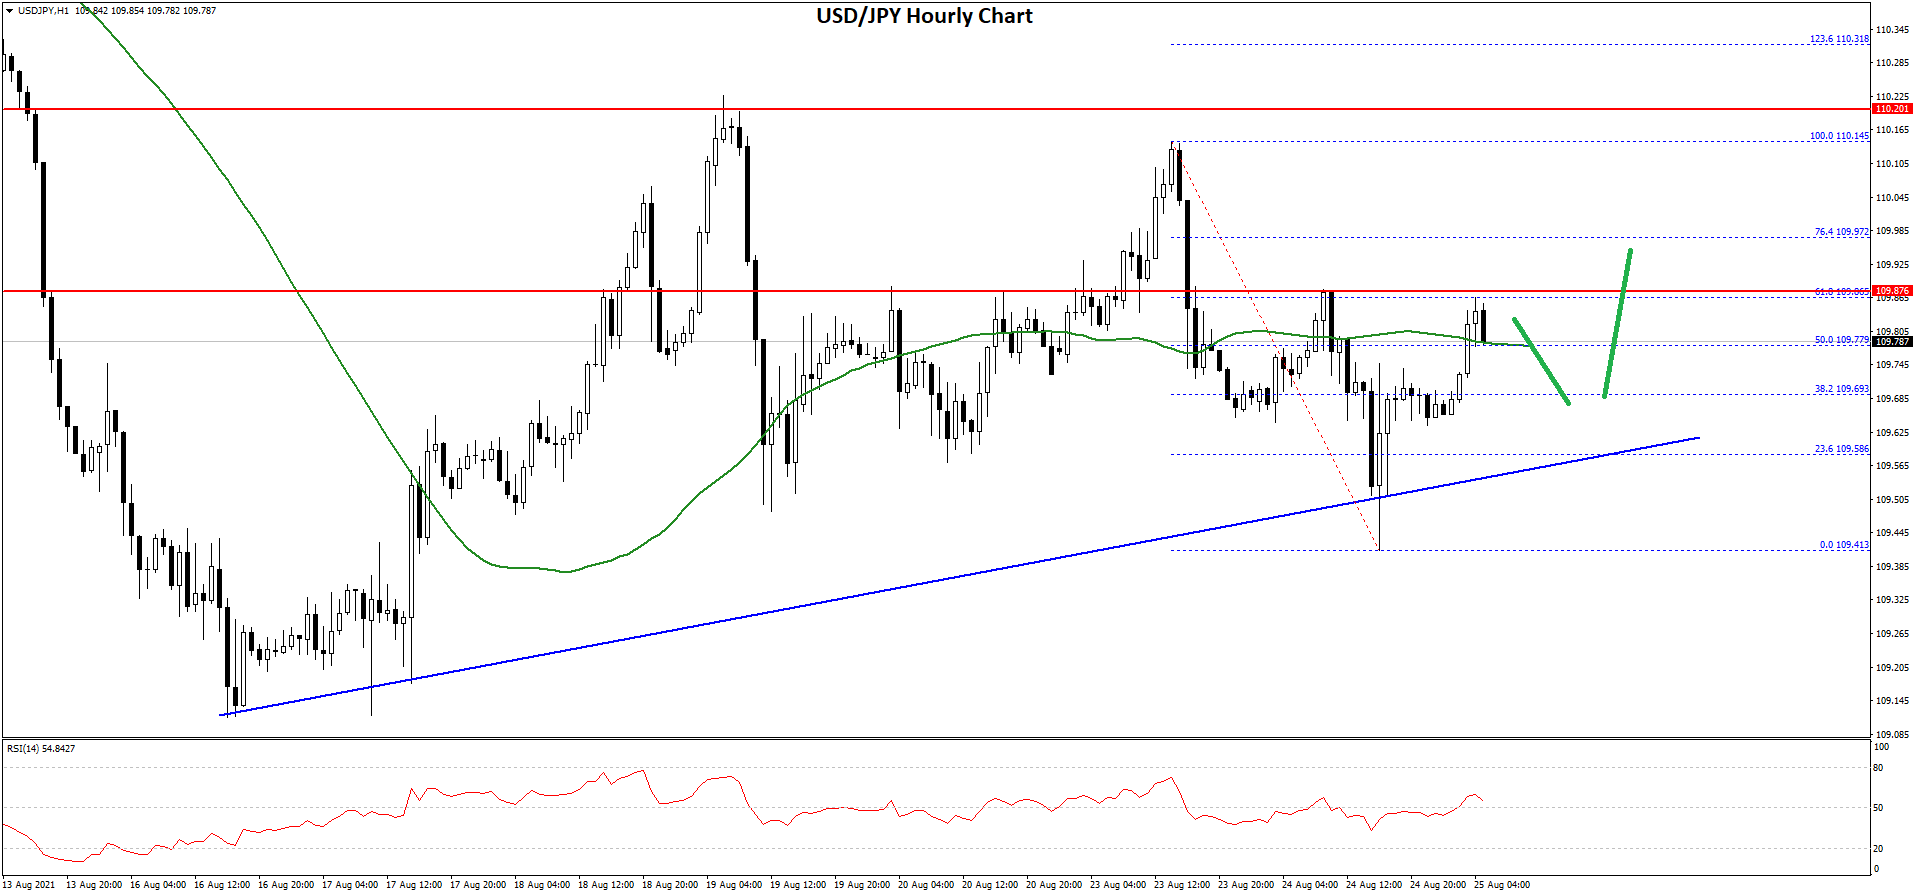
It surpassed the 50% Fib retracement level of the recent decline from the 110.14 high to 109.41 low. On the upside, an initial resistance is near the 109.85 level.
The next major resistance is near the 110.00 level or the 76.4% Fib retracement level of the recent decline from the 110.14 high to 109.41 low, above which the pair is likely to rise steadily in the coming sessions.
An initial support on the downside is near the 109.75 level. There is also a major bullish trend line forming with support near 109.60 on the hourly chart.
If there is a downside break below the trend line, the pair could decline towards the 109.40. Any more losses could open the doors for a move towards the 109.00 support zone. The next key support could be 108.80.
This forecast represents FXOpen Markets Limited opinion only, it should not be construed as an offer, invitation or recommendation in respect to FXOpen Markets Limited products and services or as financial advice.
Trade over 50 forex markets 24 hours a day with FXOpen. Take advantage of low commissions, deep liquidity, and spreads from 0.0 pips (additional fees may apply). Open your FXOpen account now or learn more about trading forex with FXOpen.
This article represents the opinion of the Companies operating under the FXOpen brand only. It is not to be construed as an offer, solicitation, or recommendation with respect to products and services provided by the Companies operating under the FXOpen brand, nor is it to be considered financial advice.
Stay ahead of the market!
Subscribe now to our mailing list and receive the latest market news and insights delivered directly to your inbox.


Latest articles

US Dollar Strengthens Amid Equity Market Weakness and Hawkish Fed Rhetoric
The US dollar continues to hold firm near multi-year highs as sentiment across equity markets deteriorates and investors increasingly expect the Federal Reserve to maintain a restrictive monetary policy stance for longer. The US economy remains resilient, while inflation risks

Bitcoin: Corrective Channel Broken as Traders Turn More Active
Bitcoin has come under the influence of several factors simultaneously. The wave of selling at the beginning of June was linked to Strategy's first disclosed Bitcoin sale in several years, a prolonged series of outflows from spot ETFs, and a

DAX 40: consolidation amid technology sell-off
A wave of selling in the technology sector that emerged earlier this week has weighed on European equities. The trigger was investor concern over the profitability of large-scale debt-funded investments by major US tech companies in AI infrastructure. The Nasdaq