


EUR/USD and EUR/JPY At Risk of More Downsides
FXOpen

EUR/USD started a fresh decline from the 1.1280 resistance. EUR/JPY is also declining and facing a string resistance near the 128.60 level.
Important Takeaways for EUR/USD and EUR/JPY
· The Euro started a fresh decline after it failed to stay above 1.1320.
· There is key bearish trend line forming with resistance near 1.1180 on the hourly chart.
· EUR/JPY gained bearish momentum after it broke the 128.80 support zone.
· There is a major bearish trend line forming with resistance near 128.30 on the hourly chart.
EUR/USD Technical Analysis
The Euro faced sellers near the 1.1350 zone against the US Dollar. The EUR/USD pair started a fresh decline below the 1.1320 and 1.1300 support levels.
The pair traded below the 1.1280 pivot level and the 50 hourly simple moving average. Finally, the pair traded as low as 1.1089 On FXOpen and is currently consolidating gains. It corrected above the 23.6% Fib retracement level of the recent decline from the 1.1232 high to 1.1089 low.
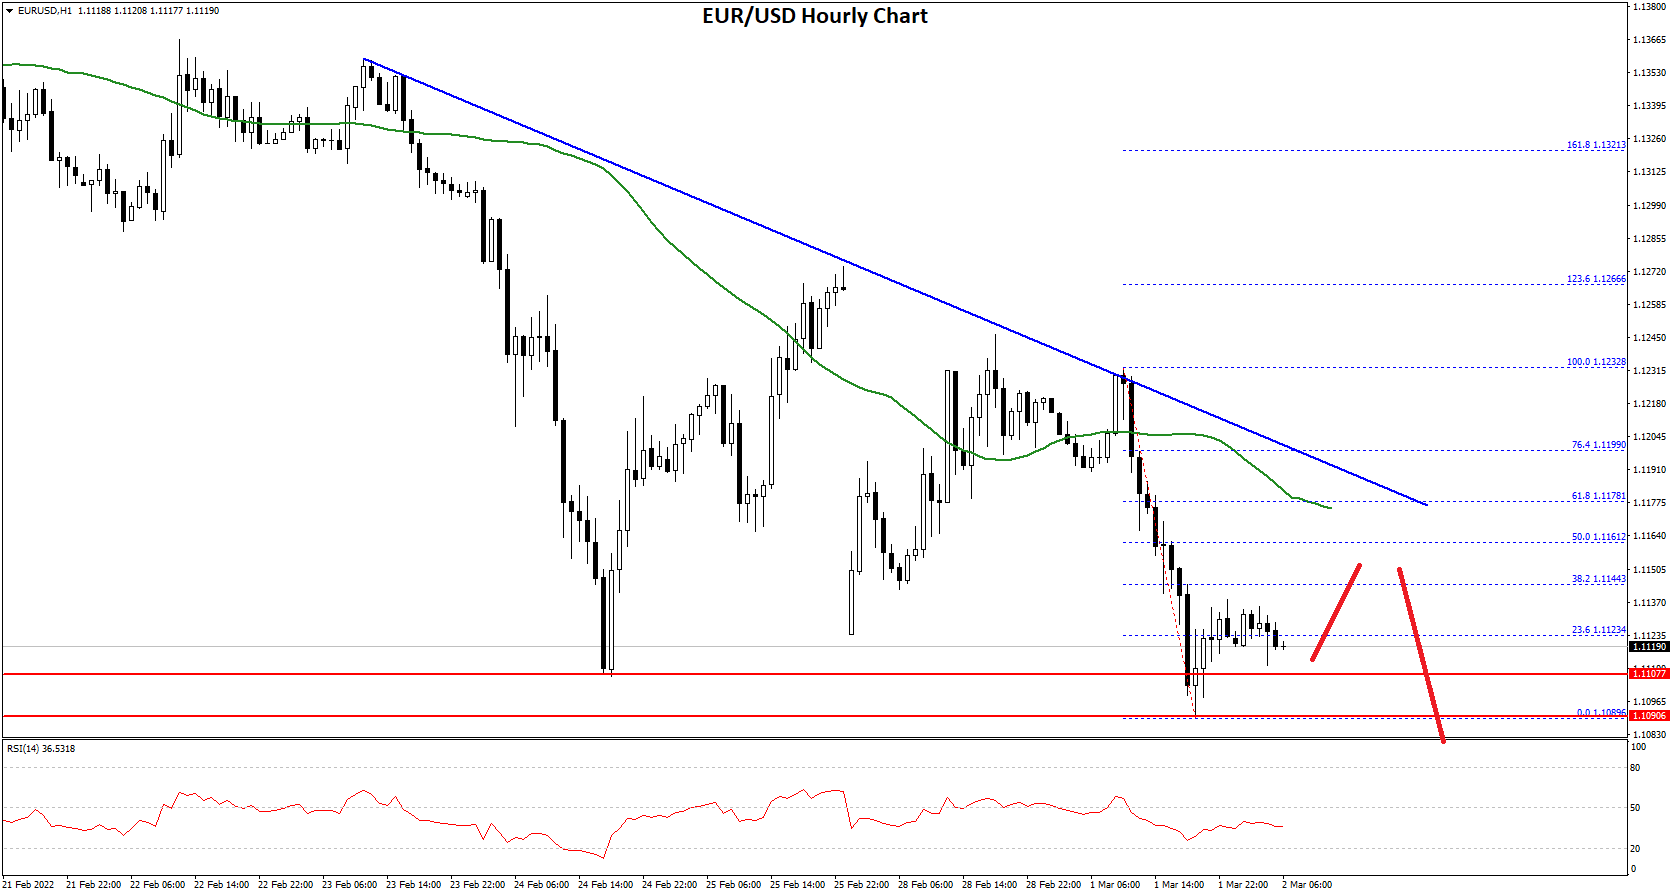
On the upside, the pair is facing resistance near the 1.1150 level. It is near the 50% Fib retracement level of the recent decline from the 1.1232 high to 1.1089 low.
The next major resistance is near the 1.1180 level. There is also a key bearish trend line forming with resistance near 1.1180 on the hourly chart. A clear break above the 1.1180 resistance could push EUR/USD towards 1.1220.
If the bulls remain in action, the pair could rise above the 1.1220 resistance zone in the near term. On the downside, the pair might find support near the 1.1080 level.
If there is a downside break below the 1.1080 support, the pair might accelerate lower. The next major support sits near the 1.1020 level, below which there is a risk of a larger decline.
EUR/JPY Technical Analysis
The Euro also followed a similar path from the 130.30 resistance against the Japanese Yen. The EUR/JPY pair declined below the 130.00 and 129.50 support levels to enter a bearish zone.
The pair settled below the key 128.80 support and the 50 hourly simple moving average. It traded as low as 127.37 and is currently consolidating losses. EUR/JPY is testing the 23.6% Fib retracement level of the recent decline from the 129.78 swing high to 127.37 low.
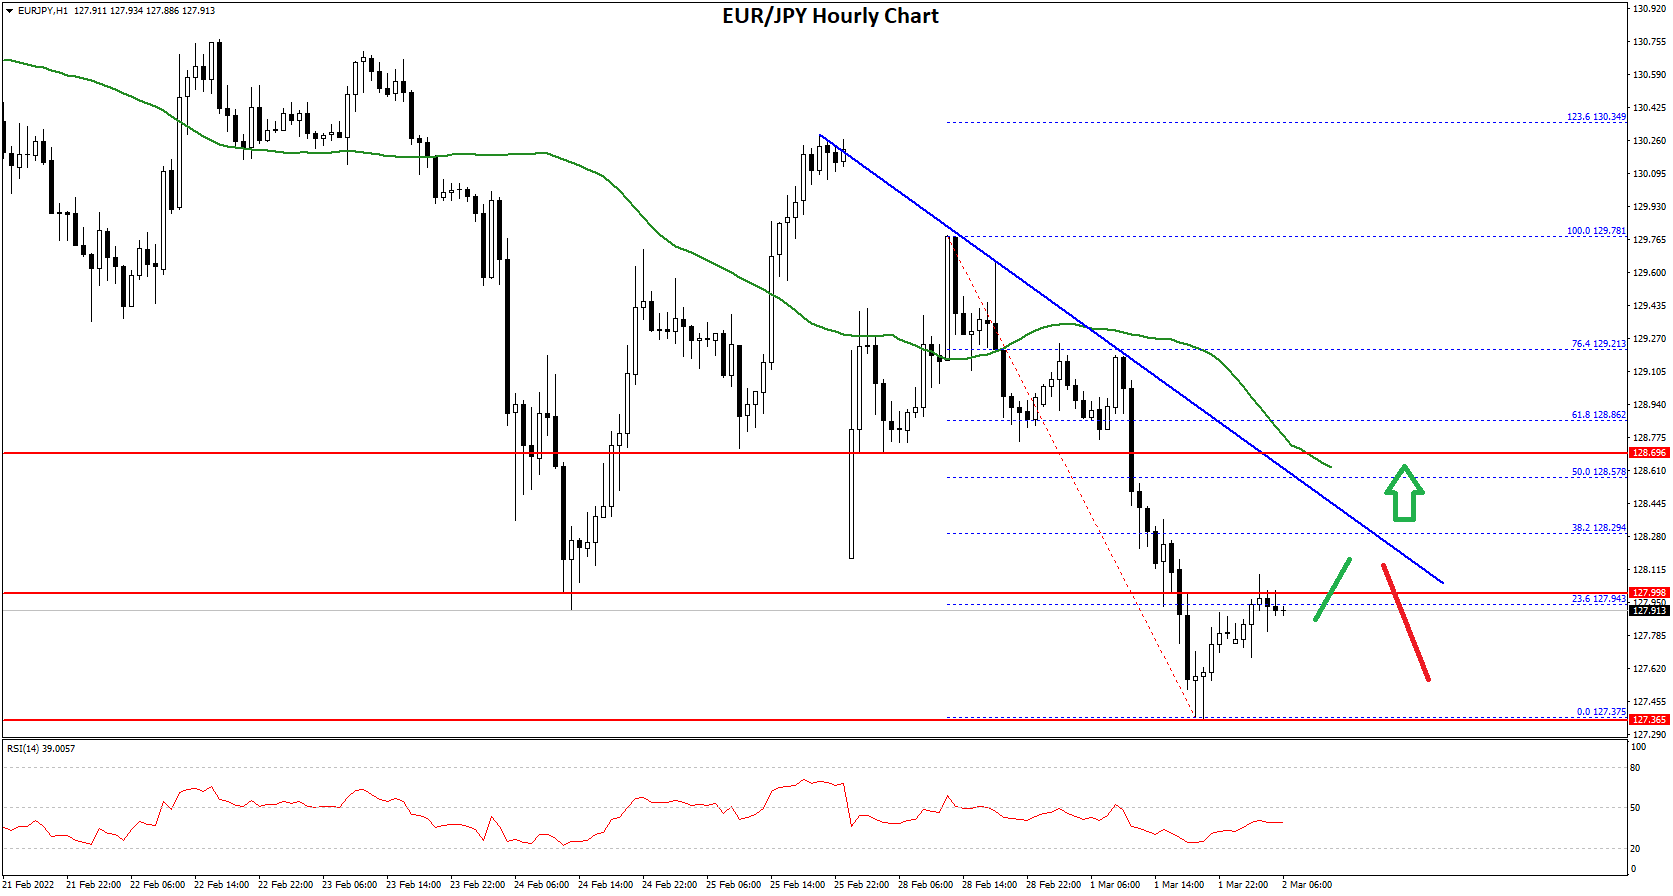
On the upside, an immediate resistance is near the 128.25 level. There is also a major bearish trend line forming with resistance near 128.30 on the hourly chart.
If there is an upside break above the 128.30 resistance, the pair could test the 128.60 resistance and the 50 hourly simple moving average. It is near the 50% Fib retracement level of the recent decline from the 129.78 swing high to 127.37 low.
The next major resistance could be near the 128.80 level, above which the pair could gain bullish momentum. In the stated case, the pair could rise towards the 129.50 level. Any more gains could lead the pair towards the 130.00 level in the near term.
If not, the pair might continue lower below the 127.60 level. The next major support is near the 127.40 level. Any more losses could lead the pair towards the 126.50 support level in the near term.
This forecast represents FXOpen Markets Limited opinion only, it should not be construed as an offer, invitation or recommendation in respect to FXOpen Markets Limited products and services or as financial advice.
Trade over 50 forex markets 24 hours a day with FXOpen. Take advantage of low commissions, deep liquidity, and spreads from 0.0 pips (additional fees may apply). Open your FXOpen account now or learn more about trading forex with FXOpen.
This article represents the opinion of the Companies operating under the FXOpen brand only. It is not to be construed as an offer, solicitation, or recommendation with respect to products and services provided by the Companies operating under the FXOpen brand, nor is it to be considered financial advice.
Stay ahead of the market!
Subscribe now to our mailing list and receive the latest market news and insights delivered directly to your inbox.


Latest articles

Amazon Earnings: Does the Chart Already Know Something the Numbers Don't?
All eyes are on July 30, when Amazon reports Q2 2026 earnings, with Wall Street increasingly convinced the bar has been set too low. Consensus sees EPS near $1.82-$2.26 on roughly $197 billion in revenue, but the

WTI Analysis: Gap Breaks Short-Term Trend as Price Remains Trapped Between the POC and Profile Boundary
WTI crude oil plunged by more than 7% on 27 July 2026 after the US suspended a series of strikes against Iran over the weekend, raising hopes of a diplomatic solution and the reopening of shipping through the Strait of

US Dollar Index: A Defining Week for the King of the Markets
The dollar heads into a pivotal week trading near 101.80, just off a 15-month high, with the Fed's July 29 meeting standing as the clear focal point. Markets currently price roughly a 65% chance of a hold, though renewed