


EUR/USD And EUR/JPY At Risk of More Downsides
FXOpen

EUR/USD is currently correcting lower and facing a strong resistance near the 1.1040 level. EUR/JPY is also showing a few bearish signs and it could decline further as long as it is below 119.00.
Important Takeaways for EUR/USD and EUR/JPY
- The Euro is struggling to recover above the 1.1040 and 1.1050 resistance levels.
- There was a break below a major bullish trend line with support near 1.1000 on the hourly chart of EUR/USD.
- EUR/JPY declined steadily below 120.00 and it even tested the 118.20 zone.
- There is a key bearish trend line forming with resistance near 118.95 on the hourly chart.
EUR/USD Technical Analysis
This past week, the Euro started a solid recovery wave above the 1.1000 resistance area against the US Dollar. The EUR/USD pair broke the 1.1040 resistance area to move into a positive zone.
Moreover, there was a break above the 1.1080 level and the 50 hourly simple moving average. The pair traded as high as 1.1147 and it recently started a downside correction.
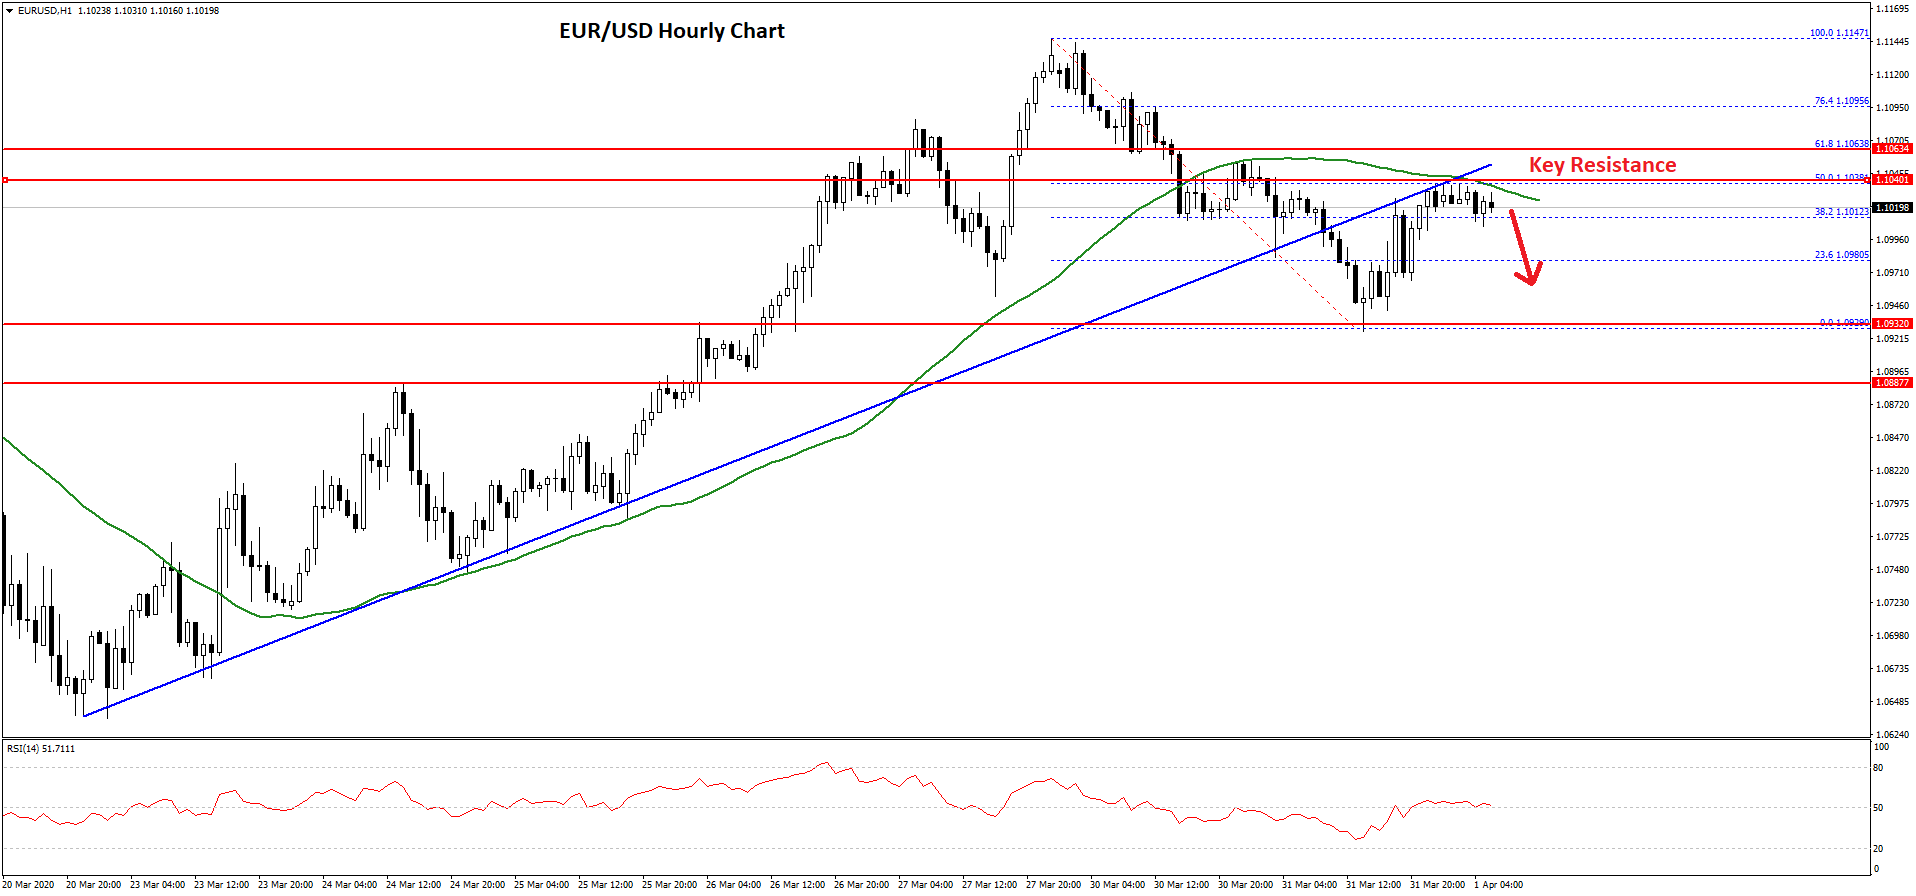
There was a break below the 1.1100 and 1.1080 levels. More importantly, there was a break below a major bullish trend line with support near 1.1000 on the hourly chart of EUR/USD.
The pair even broke the 50 hourly SMA and tested the 1.0940 support area. A low is formed near 1.0939 and the pair is currently rising. It is trading above the 1.1000 level, plus the 23.6% Fib retracement level of the recent decline from the 1.1147 high to 1.0939 low.
However, the previous support near the 1.1040 level and the 50 hourly SMA is now acting as a barrier for the bulls. The 50% Fib retracement level of the recent decline from the 1.1147 high to 1.0939 low is also preventing a fresh increase.
Therefore, a clear break above the 1.1040 and 1.1050 resistance levels is needed for a fresh increase towards 1.1100 and 1.1150. If not, EUR/USD is likely to decline again towards 1.0940 or 1.0920 in the near term.
EUR/JPY Technical Analysis
The Euro followed a bearish path from well above the 121.00 zone against the Japanese Yen. The EUR/JPY pair broke the key 120.00 support area to move into a bearish zone.
Moreover, there was a close below the 119.00 level and the 50 hourly simple moving average. The pair traded as low as 118.20 and it is currently correcting higher.
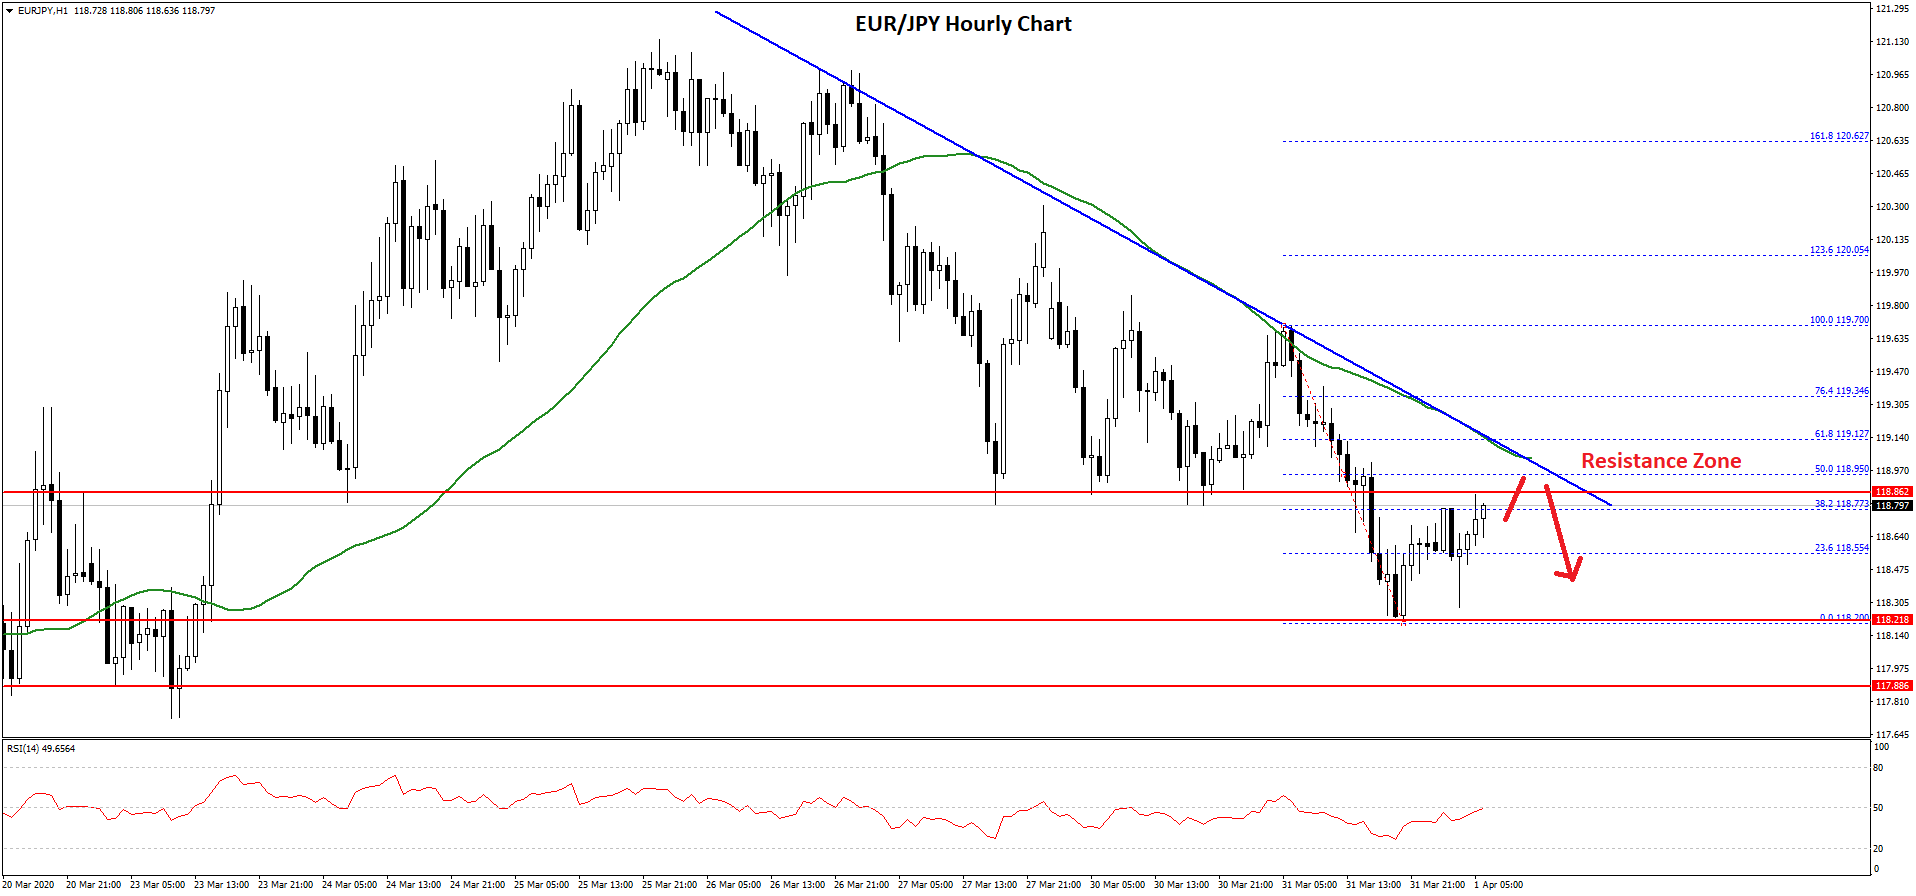
There was a break above the 118.50 resistance. Besides, the pair climbed above the 23.6% Fib retracement level of the recent decline from the 119.70 high to 118.20 low.
On the upside, an initial resistance is near the 118.80 level. The main resistance is near the 119.00 level. There is also a key bearish trend line forming with resistance near 118.95 on the hourly chart.
The 50% Fib retracement level of the recent decline from the 119.70 high to 118.20 low is also near the 118.95 level to act as a resistance along with the 50 hourly SMA.
Therefore, a break above the 119.00 resistance and the 50 hourly SMA is needed for a strong recovery. If not, the EUR/JPY pair is likely to resume its decline below 118.50. The main supports are near 118.20 and 117.80.
Trade over 50 forex markets 24 hours a day with FXOpen. Take advantage of low commissions, deep liquidity, and spreads from 0.0 pips (additional fees may apply). Open your FXOpen account now or learn more about trading forex with FXOpen.
This article represents the opinion of the Companies operating under the FXOpen brand only. It is not to be construed as an offer, solicitation, or recommendation with respect to products and services provided by the Companies operating under the FXOpen brand, nor is it to be considered financial advice.
Stay ahead of the market!
Subscribe now to our mailing list and receive the latest market news and insights delivered directly to your inbox.


Latest articles

Pound at Key Levels: Markets Assess Impact of Political Uncertainty in the UK
The British pound remains under pressure following increased political uncertainty in the United Kingdom triggered by the Prime Minister’s resignation. Investors are assessing potential shifts in the political and economic policy outlook after the head of government stepped down,

Silver: Fed Tightens Its Tone as Price Returns to the Volume Profile Zone
Silver came under pressure following the Federal Reserve’s June meeting, at which policymakers kept interest rates unchanged at 3.50–3.75%. Nine of the 18 committee members still see the possibility of a rate increase this year, reinforcing

Ethereum: Market Assesses the Strength of the Corrective Recovery
Following a period of heightened volatility in early June, investor attention in Ethereum has once again shifted towards institutional demand and the development of the spot ETF market in the United States. The funds launched last year continue to serve