


EUR/USD and EUR/JPY Attempt Recovery Wave
FXOpen
EUR/USD started a fresh decline and traded below 1.0150. EUR/JPY is attempting a recovery wave and might rise if it clears 139.50.
Important Takeaways for EUR/USD and EUR/JPY
· The Euro started a major decline from the 1.0250 and 1.0280 resistance levels.
· There is a short-term contracting triangle forming with resistance near 1.0145 on the hourly chart.
· EUR/JPY also started a major decline below the 140.00 and 139.50 support levels.
· There is a key bearish trend line forming with resistance near 139.20 on the hourly chart.
EUR/USD Technical Analysis
The Euro failed to clear the 1.0280 resistance against the US Dollar. The EUR/USD pair started a major decline below the 1.0220 and 1.0200 support levels.
There was a clear move below the 1.0150 level and the 50 hourly simple moving average. The pair even settled below the 1.0180 level. A low was formed near 1.0107 on FXOpen and the pair is now consolidating losses.
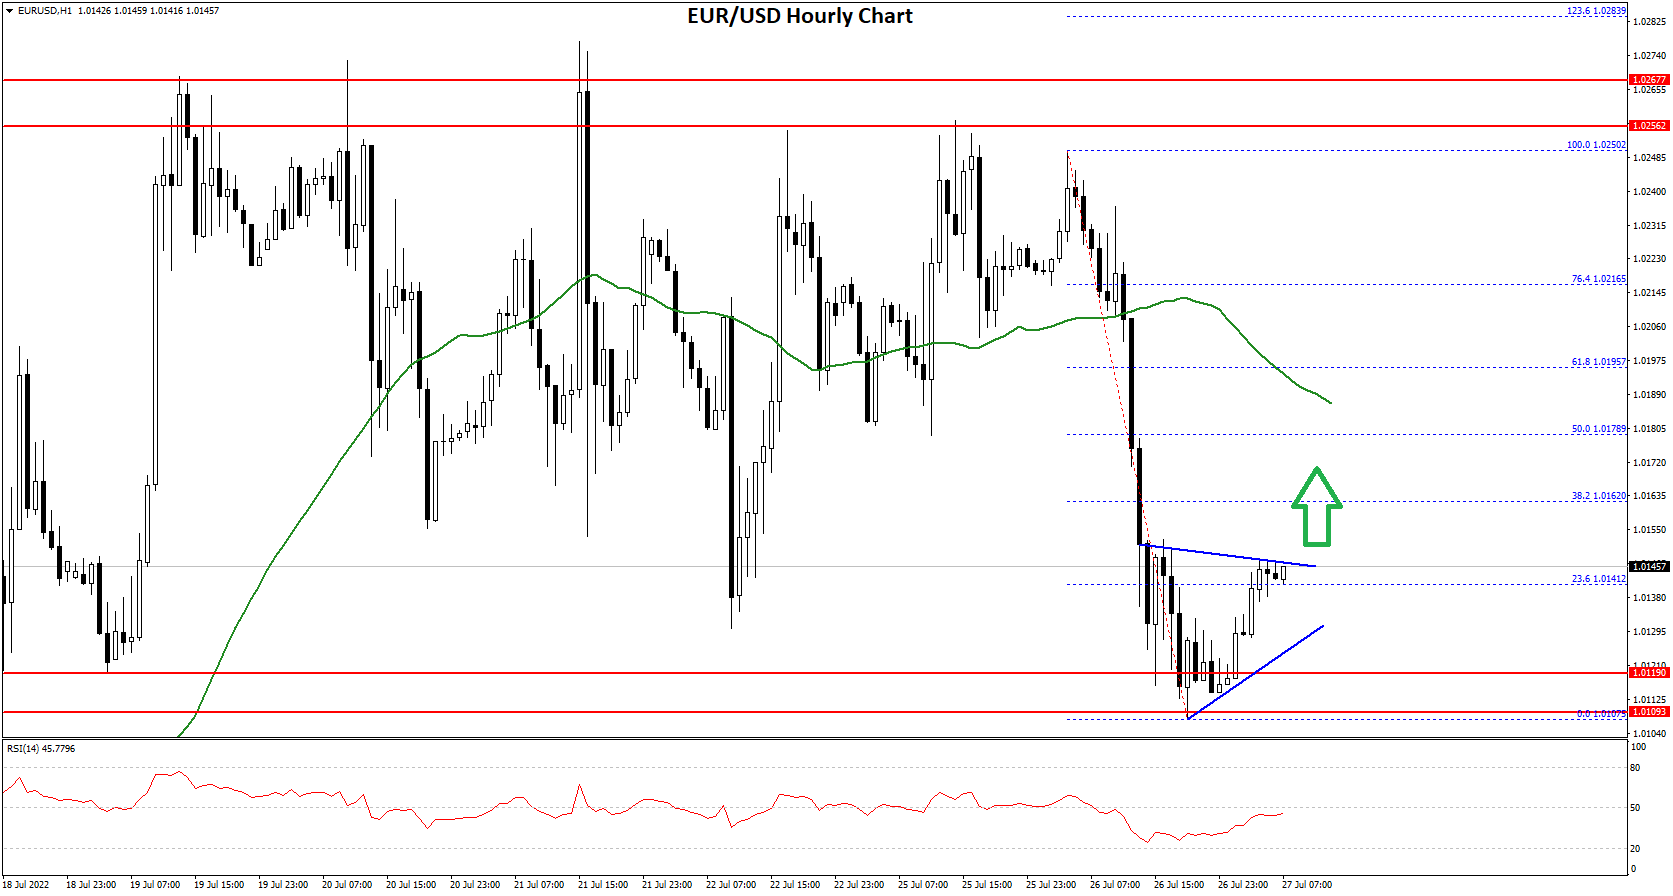
The pair climbed above the 23.6% Fib retracement level of the downward move from the 1.0250 swing high to 1.0107 low. On the upside, the pair is facing resistance near the 1.0145 level.
There is also a short-term contracting triangle forming with resistance near 1.0145 on the hourly chart. A clear move above the triangle resistance might send the price towards 1.0165. The next major resistance is near the 1.0180 level.
It is near the 50% Fib retracement level of the downward move from the 1.0250 swing high to 1.0107 low. If the bulls remain in action, the pair could revisit the 1.0250 resistance zone in the near term.
On the downside, the pair might find support near the 1.0120 level. The next major support sits near the 1.0100 level. If there is a downside break below the 1.0100 support, the pair might accelerate lower in the coming sessions.
EUR/JPY Technical Analysis
The Euro also started a fresh decline from the 142.00 resistance against the Japanese Yen. The EUR/JPY pair gained pace and traded below the 141.00 support level.
The pair even broke the 140.00 level and the 50 hourly simple moving average. It traded as low as 138.13 and is currently correcting losses. An immediate resistance on the upside is near the 139.00 level. It is near the 50% Fib retracement level of the downward move from the 139.83 swing high to 138.13 low.
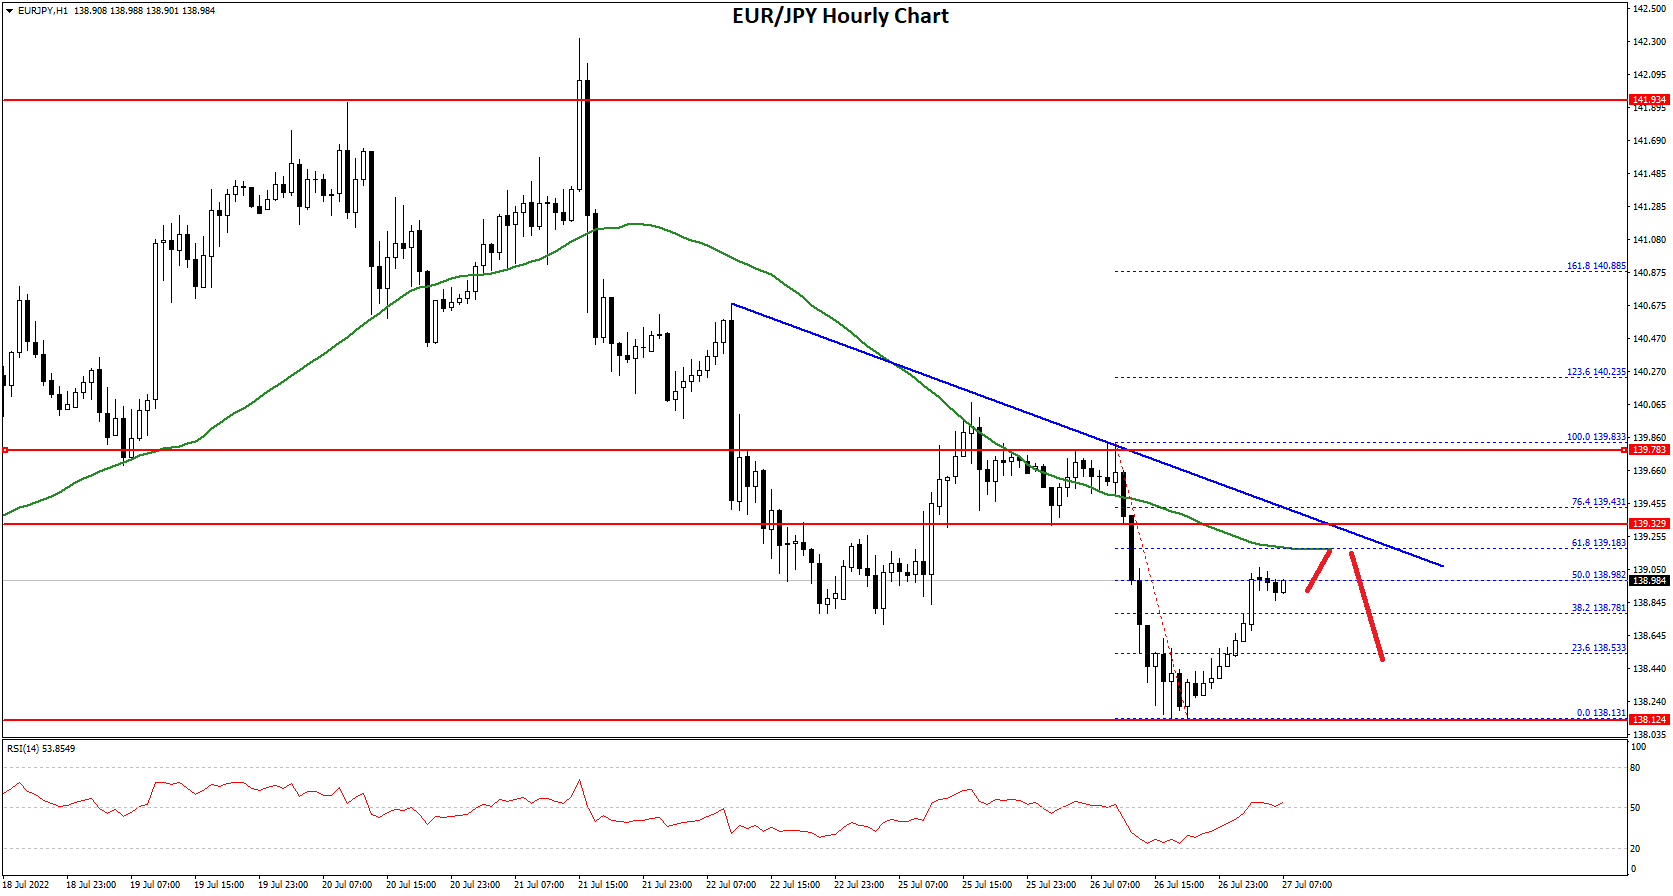
The next major resistance could be near the 139.20 level. There is also a key bearish trend line forming with resistance near 139.20 on the hourly chart.
The trend line is near the 61.8% Fib retracement level of the downward move from the 139.83 swing high to 138.13 low. If there is an upside break above the 139.20 resistance, the pair could test the 139.50 resistance. Any more gains might send the pair towards the 140.00 level.
If not, the pair could start a fresh decline below the 138.75 support. The next major support is near the 138.50 level. The main support sits near the 138.20 level. Any more losses could lead the pair towards the 137.50 support level in the near term.
This forecast represents FXOpen Markets Limited opinion only, it should not be construed as an offer, invitation or recommendation in respect to FXOpen Markets Limited products and services or as financial advice.
Trade over 50 forex markets 24 hours a day with FXOpen. Take advantage of low commissions, deep liquidity, and spreads from 0.0 pips (additional fees may apply). Open your FXOpen account now or learn more about trading forex with FXOpen.
This article represents the opinion of the Companies operating under the FXOpen brand only. It is not to be construed as an offer, solicitation, or recommendation with respect to products and services provided by the Companies operating under the FXOpen brand, nor is it to be considered financial advice.
Stay ahead of the market!
Subscribe now to our mailing list and receive the latest market news and insights delivered directly to your inbox.


Latest articles

Silver Attempts to Break Out of Its Range
Silver continues to balance between its dual role as an industrial metal and so-called refuge asset, and this combination largely explains the lack of a clear trend in recent weeks. Shifting expectations for central bank interest rates can influence the

Nasdaq 100: Is This the Correction Traders Have Been Waiting For?
The Nasdaq 100 (US Tech 100 Mini on FXOpen) remains caught between two opposing forces: cooling inflation on one side, and persistent geopolitical instability on the other. On 14 July, June's CPI print came in softer than expected, easing near-term

XRP/USD: Symmetrical Triangle Forms as Trading Volume Fades
On 6 July, Ripple received a full Crypto-Asset Service Provider (CASP) licence under the Markets in Crypto-Assets (MiCA) regulation from Luxembourg's financial regulator, the CSSF. The approval allows the company to offer regulated crypto payment services across all 30 countries