


EUR/USD and EUR/JPY Could Climb Further Higher
FXOpen

EUR/USD is slowly moving higher above 0.9800. EUR/JPY is also rising and might climb further higher above the 147.25 zone.
Important Takeaways for EUR/USD and EUR/JPY
· The Euro started a recovery wave and was able to clear the 0.9800 resistance zone.
· There is a key bullish trend line forming with support near 0.9835 on the hourly chart.
· EUR/JPY started a strong increase and settled well above the 145.50 zone.
· There is a major bullish trend line forming with support near 146.90 on the hourly chart.
EUR/USD Technical Analysis
The Euro formed a base above the 0.9660 zone and started recovery wave against the US Dollar. The EUR/USD pair was able to clear the 0.9720 and 0.9750 resistance levels.
There was a clear move above the 0.9800 level and the 50 hourly simple moving average. The pair even climbed above 0.9850 and traded as high as 0.9875 on FXOpen. It is now consolidating gains near the 0.9850 zone.
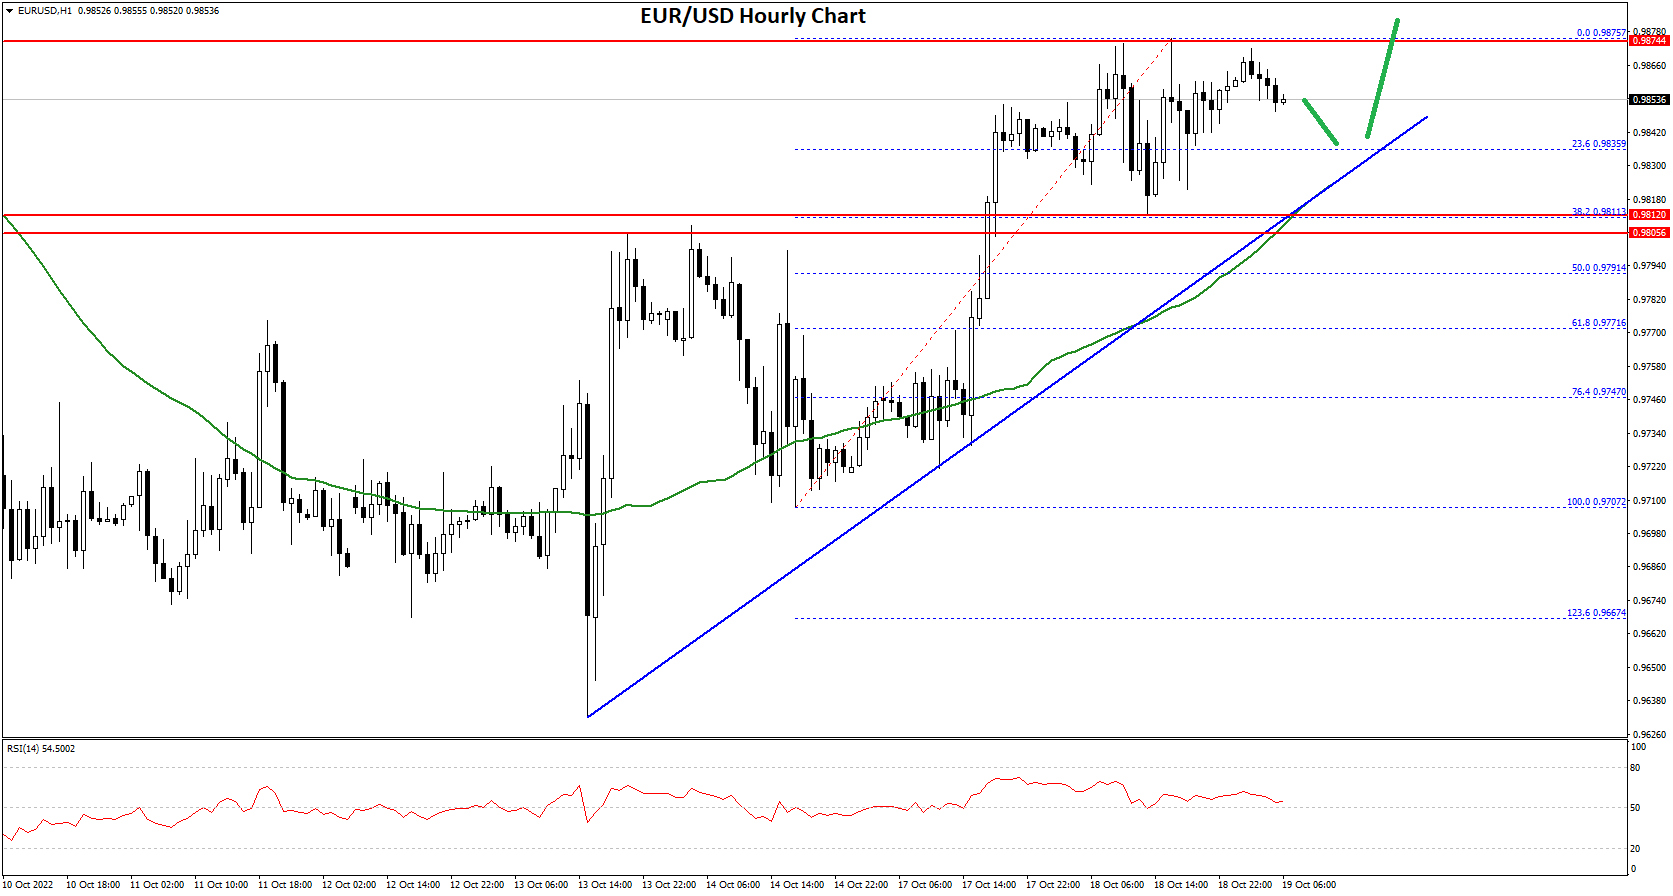
On the downside, the pair might find support near the 0.9835 level. Besides, there is a key bullish trend line forming with support near 0.9835 on the hourly chart. The trend line is near the 23.6% Fib retracement level of the upward move from the 0.9702 swing low to 0.9875 high.
The next major support sits near the 0.9810 level and the 50 hourly simple moving average, below which the pair could even test the 50% Fib retracement level of the upward move from the 0.9702 swing low to 0.9875 high.
If there is a downside break below the 0.9790 support, the pair might accelerate lower in the coming sessions. In the stated case, it could even test 0.9720.
On the upside, an immediate resistance is near the 0.9885 level. The next major resistance is near the 0.9920 level. The first major resistance is near the 0.9950 level. A clear move above the 0.9950 resistance might send the price towards 1.0000. If the bulls remain in action, the pair could revisit the 1.0050 resistance zone in the near term.
EUR/JPY Technical Analysis
The Euro remained in a strong uptrend above the 144.50 level against the Japanese Yen. The EUR/JPY pair gained pace and traded above the 145.50 resistance zone.
There was a clear move above the 146.20 support and the 50 hourly simple moving average. The pair even broke the 147.00 level and traded as high as 147.25. It is now consolidating gains near the 147.00 level.
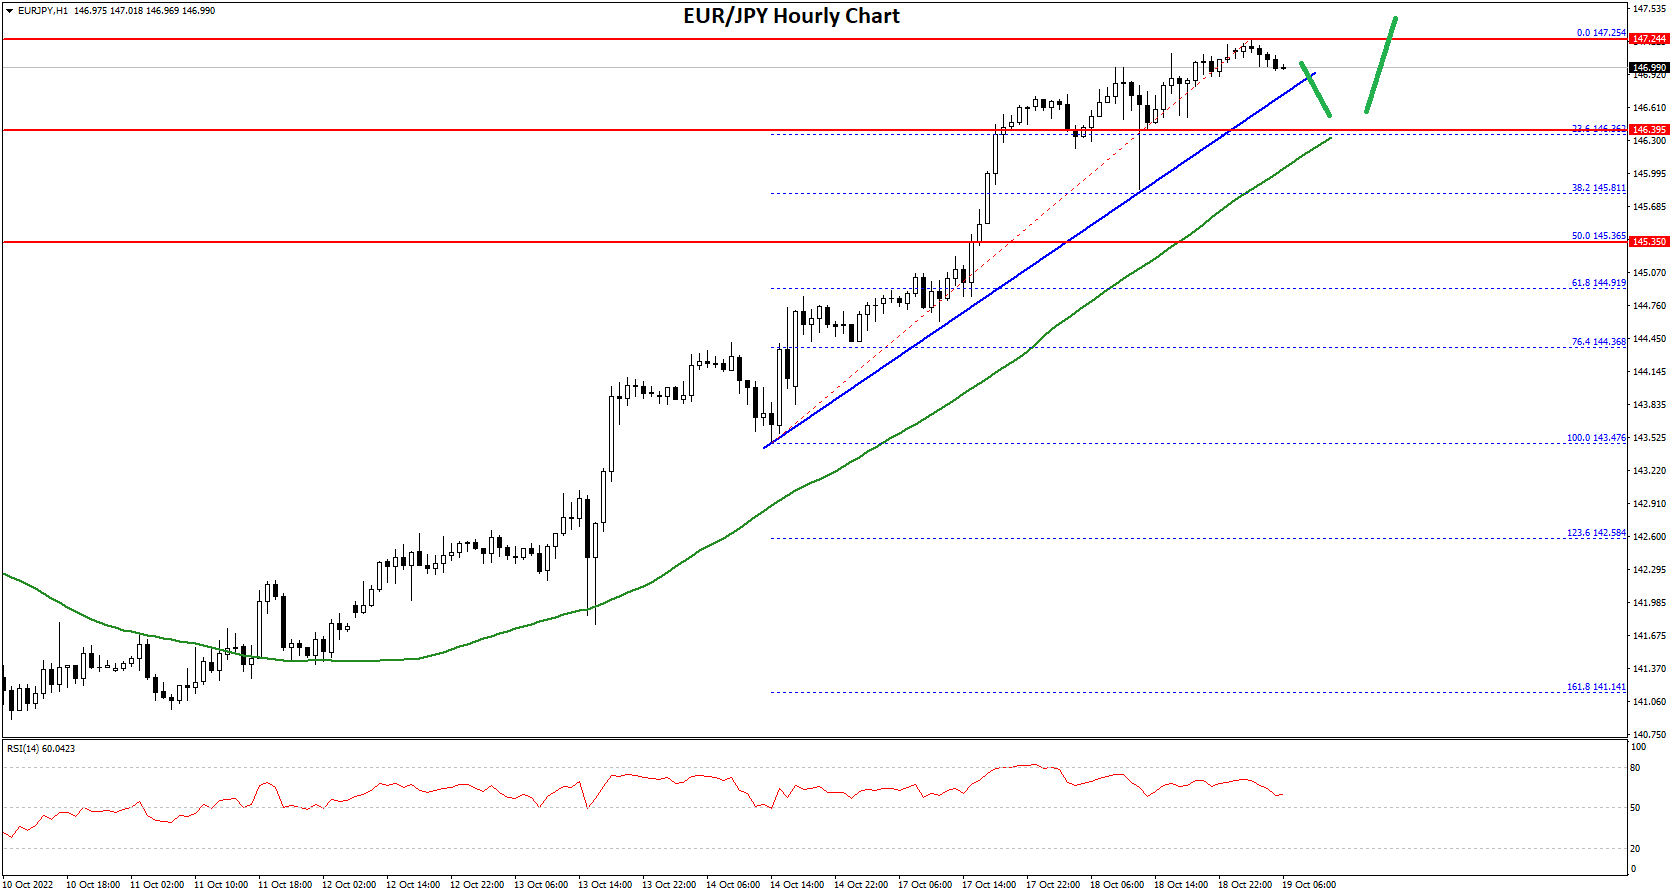
On the downside, the pair might find support near the 146.90 level. Besides, there is a major bullish trend line forming with support near 146.90 on the hourly chart.
The next major support is near 146.40 or the 50 hourly simple moving average. It is near the 23.6% Fib retracement level of the upward move from the 143.47 swing low to 147.25 high.
Any more losses could lead the pair towards the 145.50 support level in the near term. It coincides with the 50% Fib retracement level of the upward move from the 143.47 swing low to 147.25 high.
An immediate resistance on the upside is near the 147.25 level. The next major resistance could be near the 148.00 level. If there is an upside break above the 148.00 resistance, the pair could test the 149.20 resistance. Any more gains might send the pair towards the 150.00 level.
This forecast represents FXOpen Companies opinion only, it should not be construed as an offer, invitation or recommendation in respect to FXOpen Companies products and services or as financial advice.
Trade over 50 forex markets 24 hours a day with FXOpen. Take advantage of low commissions, deep liquidity, and spreads from 0.0 pips (additional fees may apply). Open your FXOpen account now or learn more about trading forex with FXOpen.
This article represents the opinion of the Companies operating under the FXOpen brand only. It is not to be construed as an offer, solicitation, or recommendation with respect to products and services provided by the Companies operating under the FXOpen brand, nor is it to be considered financial advice.
Stay ahead of the market!
Subscribe now to our mailing list and receive the latest market news and insights delivered directly to your inbox.


Latest articles

Weekly Market Insights with Gary Thomson: The Week of Central Banks and Earnings
In this video, we’ll explore the key economic events and market trends, shaping the financial landscape. Get ready for insights into financial markets to help you navigate the week ahead. Let’s dive in!
In this episode of Market

Intel at a Crossroads: Earnings Beat Meets Technical Resistance
Intel has just delivered its strongest quarter in over fifteen years, and the market reaction says it all. Q2 2026 revenue surged 25% year-over-year to $16.1 billion, crushing the consensus estimate of $14.42 billion, while adjusted EPS of

Tesla: Complex Range Structure Breaks Down Following Quarterly Earnings
Tesla released its Q2 2026 results after the market closed on 22 July. Revenue increased 26% year-on-year to $28.24 billion, while vehicle deliveries reached a record 480,126 units. However, operating margin fell sharply to 1.4%, down from