


FXOpen

EUR/USD started an upside correction above the 1.1660 and 1.1700 resistance levels. EUR/JPY tested the 124.25 resistance and it is currently correcting lower.
Important Takeaways for EUR/USD and EUR/JPY
- The Euro started a steady recovery wave from the 1.1610 zone and climbed above 1.1700.
- There was a break above a key bearish trend line with resistance near 1.1680 on the hourly chart of EUR/USD.
- EUR/JPY climbed higher nicely above the 123.00 and 123.50 resistance levels.
- There was a break above a major bearish trend line with resistance near 122.80 on the hourly chart.
EUR/USD Technical Analysis
This past week, the Euro faced an increase in selling pressure below 1.1780 against the US Dollar. The EUR/USD pair broke the 1.1700 support level to move further into a bearish zone.
The decline gained pace below the 1.1660 support level and the 50 hourly simple moving average. The pair traded close to the 1.1600 level and formed a low at 1.1612 on FXOpen.
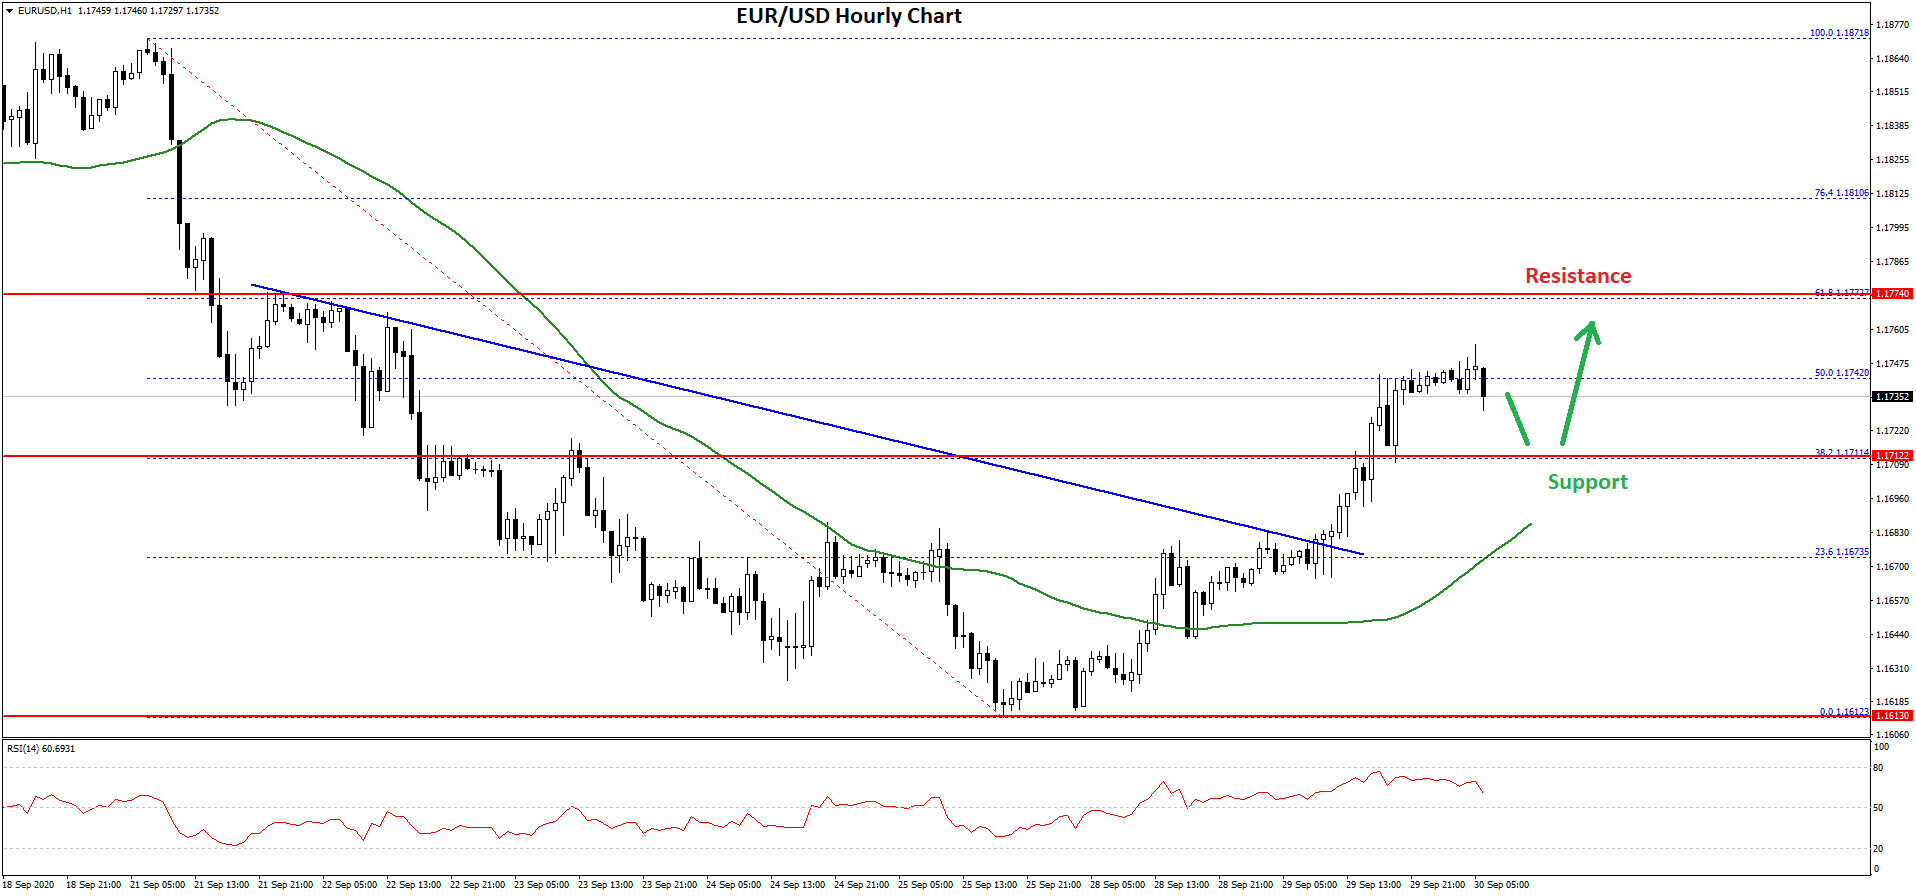
A support base was formed above 1.1600 and the pair recently started a decent upward move. There was a break above the 1.1650 and 1.1660 resistance levels. Moreover, there was a break above a key bearish trend line with resistance near 1.1680 on the hourly chart of EUR/USD.
The pair climbed above the 38.2% Fib retracement level of the key decline from the 1.1871 high to 1.1612 low. It is now trading above the 1.1720 level, but facing hurdles near 1.1740.
It seems like the 50% Fib retracement level of the key decline from the 1.1871 high to 1.1612 low is acting as a resistance. On the upside, the first major resistance is near the 1.1775 level. A clear break above 1.1775 could open the doors for more gains above the 1.1800 resistance.
Conversely, the pair might correct lower from 1.1740. An initial support is near the 1.1710 level. The next key support is near the 1.1695 level or the 50 hourly simple moving average, below which the pair is likely to revisit the 1.1612 low.
EUR/JPY Technical Analysis
The Euro started a strong upward move from the 122.37 low against the Japanese Yen. The EUR/JPY pair broke the 122.80 and 123.00 resistance levels to start a convincing recovery wave.
During the rise, there was a break above a major bearish trend line with resistance near 122.80 on the hourly chart. The pair gained pace above the 123.50 resistance and settled well above the 50 hourly simple moving average.
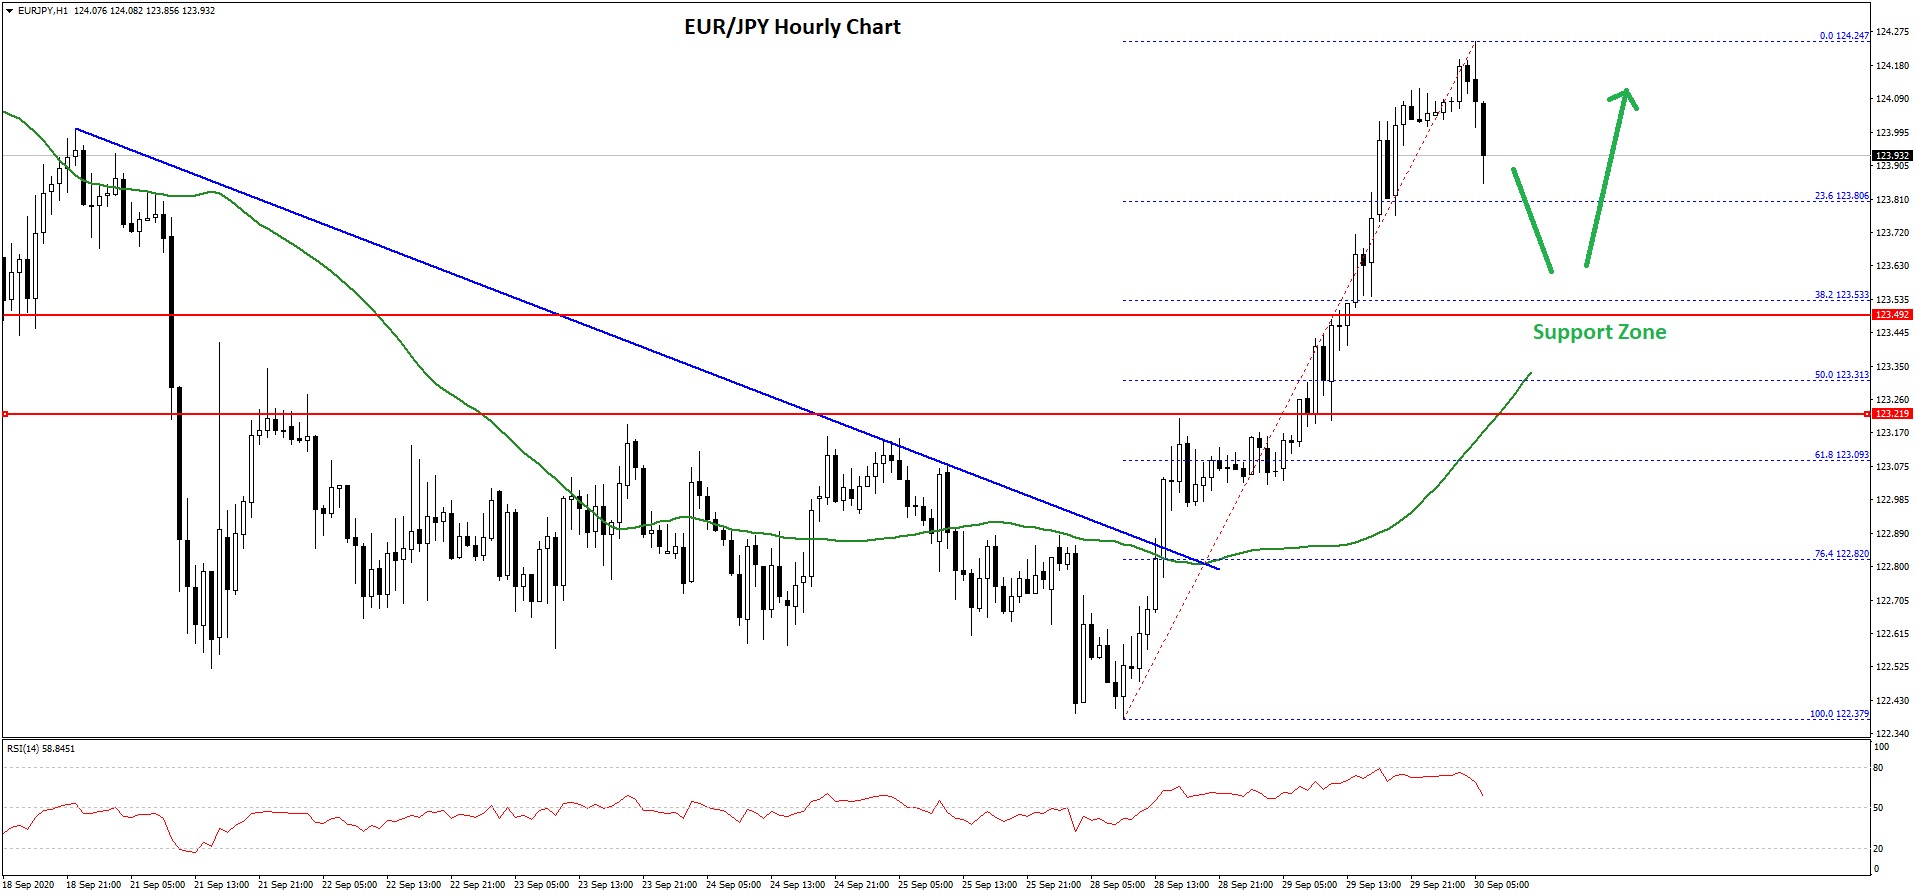
It even spiked above 124.00 and traded as high as 124.24. The pair is currently correcting lower and trading below 124.20. An initial support is near the 123.80 level or the 23.6% Fib retracement level of the recent increase from the 122.37 low to 124.24 high.
The first major support on the downside is near the 123.50 level. The main support is near the 123.30 level since it is close to the 50% Fib retracement level of the recent increase from the 122.37 low to 124.24 high.
On the upside, the EUR/JPY pair is likely to face hurdles near 124.20 and 124.25 levels. A successful close above the recent high might open the doors for a decent increase towards the 125.00 resistance level in the near term.
Trade over 50 forex markets 24 hours a day with FXOpen. Take advantage of low commissions, deep liquidity, and spreads from 0.0 pips. Open your FXOpen account now or learn more about trading forex with FXOpen.
This article represents the opinion of the Companies operating under the FXOpen brand only. It is not to be construed as an offer, solicitation, or recommendation with respect to products and services provided by the Companies operating under the FXOpen brand, nor is it to be considered financial advice.
Stay ahead of the market!
Subscribe now to our mailing list and receive the latest market news and insights delivered directly to your inbox.

Latest from Forex Analysis
Latest articles

Weekly Market Wrap With Gary Thomson: Nasdaq, EUR/USD, USD/CHF, Brent Crude Oil, Googl Shares
Get the latest scoop on the week's hottest headlines, all in one convenient video. Join Gary Thomson, the COO of FXOpen UK, as he breaks down the most significant news reports and shares his expert insights.
- Nasdaq Composite: Worst Session

Analysis of AUD/USD: Exchange Rate Falls to Early May Low
As indicated by the 4-hour AUD/USD chart today:
→ the rate fell below 0.652, a level last seen on May 2;
→ the RSI indicator dropped below 15, a level last seen during the panic over the spread of COVID-19

Analysis of AMZN Stock: Price at 1.5-Month Low
As shown in the AMZN chart, the stock price dropped below:
→ the psychological level of $180;
→ the mid-June interim low.
The last time AMZN traded below $180 was in early June.
Thus, AMZN has faced sell-offs, similar to other tech