


EUR/USD and EUR/JPY: Euro Gaining Bullish Momentum
FXOpen
EUR/USD started a strong increase and it surged above the 1.2000 resistance. EUR/JPY is also gaining momentum and it is trading well above the 125.00 resistance.
Important Takeaways for EUR/USD and EUR/JPY
- The Euro started a strong increase above the 1.1950 and 1.2000 resistance levels.
- There was a break above a key connecting resistance trend line at 1.2030 on the hourly chart of EUR/USD.
- EUR/JPY followed a similar pattern and broke the main 125.00 resistance.
- There was a break above a major rising channel with resistance near 125.30 on the hourly chart.
EUR/USD Technical Analysis
This week, the Euro formed a strong support zone above the 1.1920 and 1.1950 levels against the US Dollar. The EUR/USD pair started a strong increase and it broke the main 1.2000 resistance level.
The pair even gained strength above 1.2020 and settled above the 50 hourly simple moving average. Moreover, there was a break above a key connecting resistance trend line at 1.2030 on the hourly chart of EUR/USD.
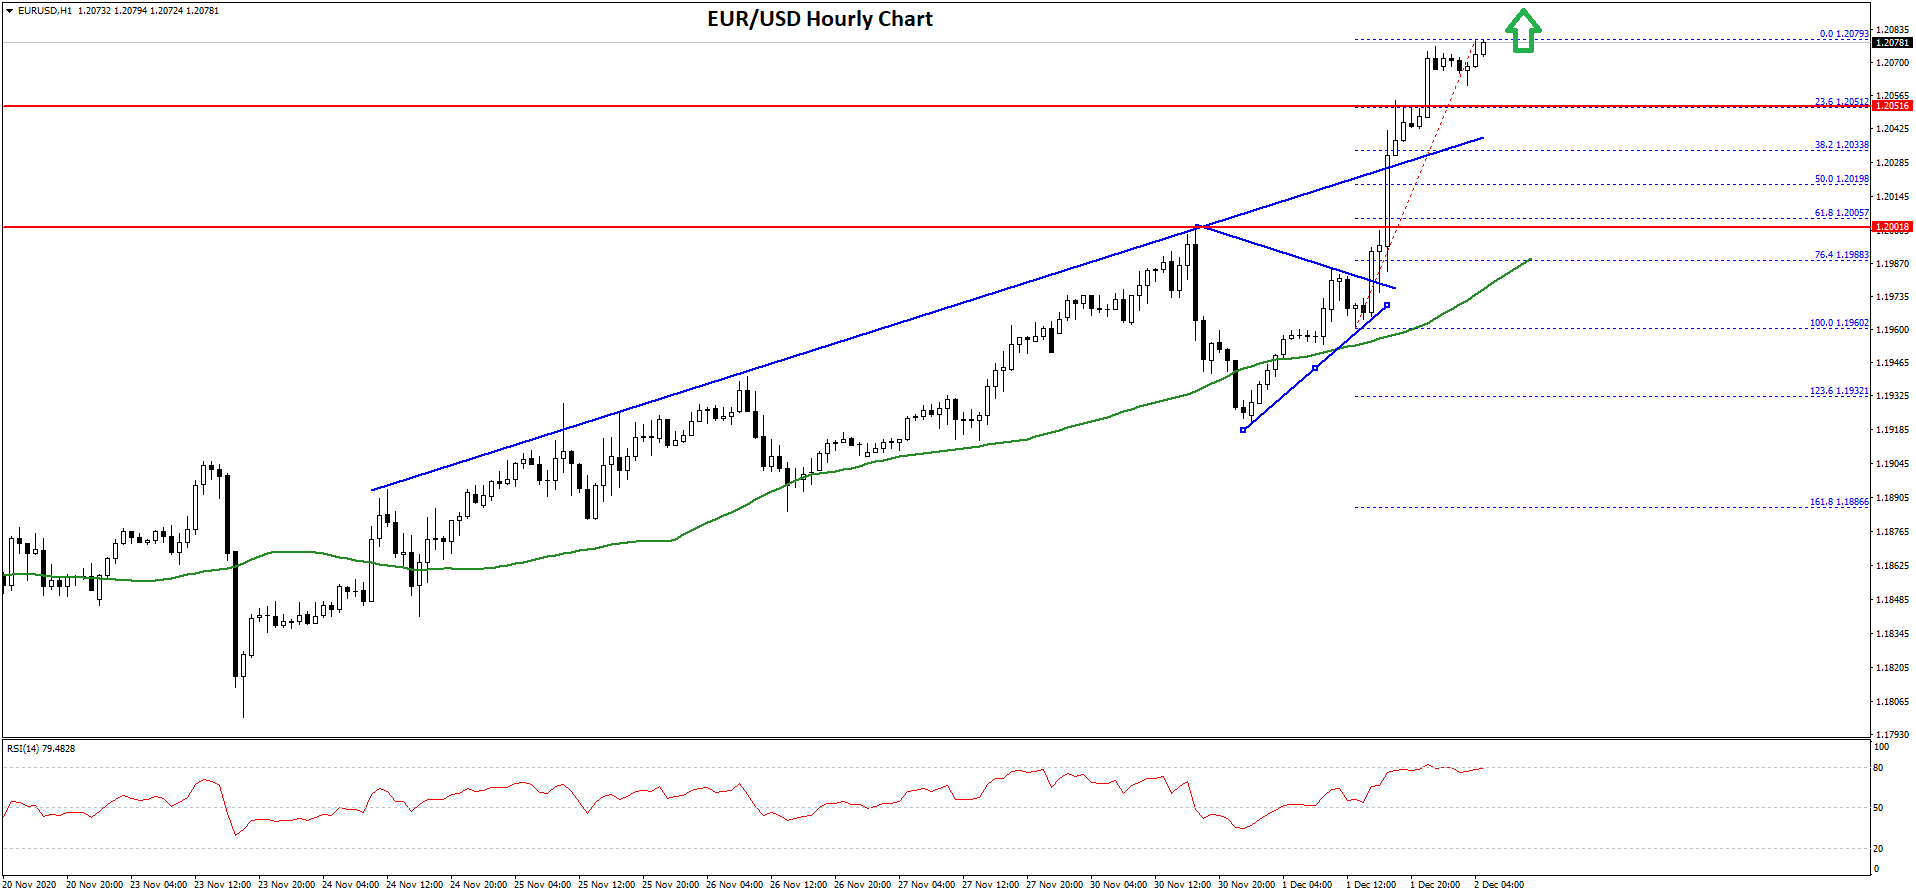
The pair even surpassed the 1.2050 resistance and traded as high as 1.2079 recently on FXOpen. It seems like the pair might continue to move higher above the 1.2080 level.
The next key resistance is near the 1.2120 level, above which the pair could test 1.2150. If there is a downside correction, an initial support could be 1.2050 or the 23.6% Fib retracement level of the recent increase from the 1.1960 swing low to 1.2079 high.
The next major support is near the 1.2030 level. Any more losses could lead the pair towards the 1.2020 support or the 50% Fib retracement level of the recent increase from the 1.1960 swing low to 1.2079 high.
EUR/JPY Technical Analysis
The Euro also followed a similar path above 124.00 against the Japanese Yen. The EUR/JPY pair broke the main 125.00 resistance level to move into a positive zone.
There was also a close above the 125.20 level and the 50 hourly simple moving average. Moreover, there was a break above a major rising channel with resistance near 125.30 on the hourly chart.
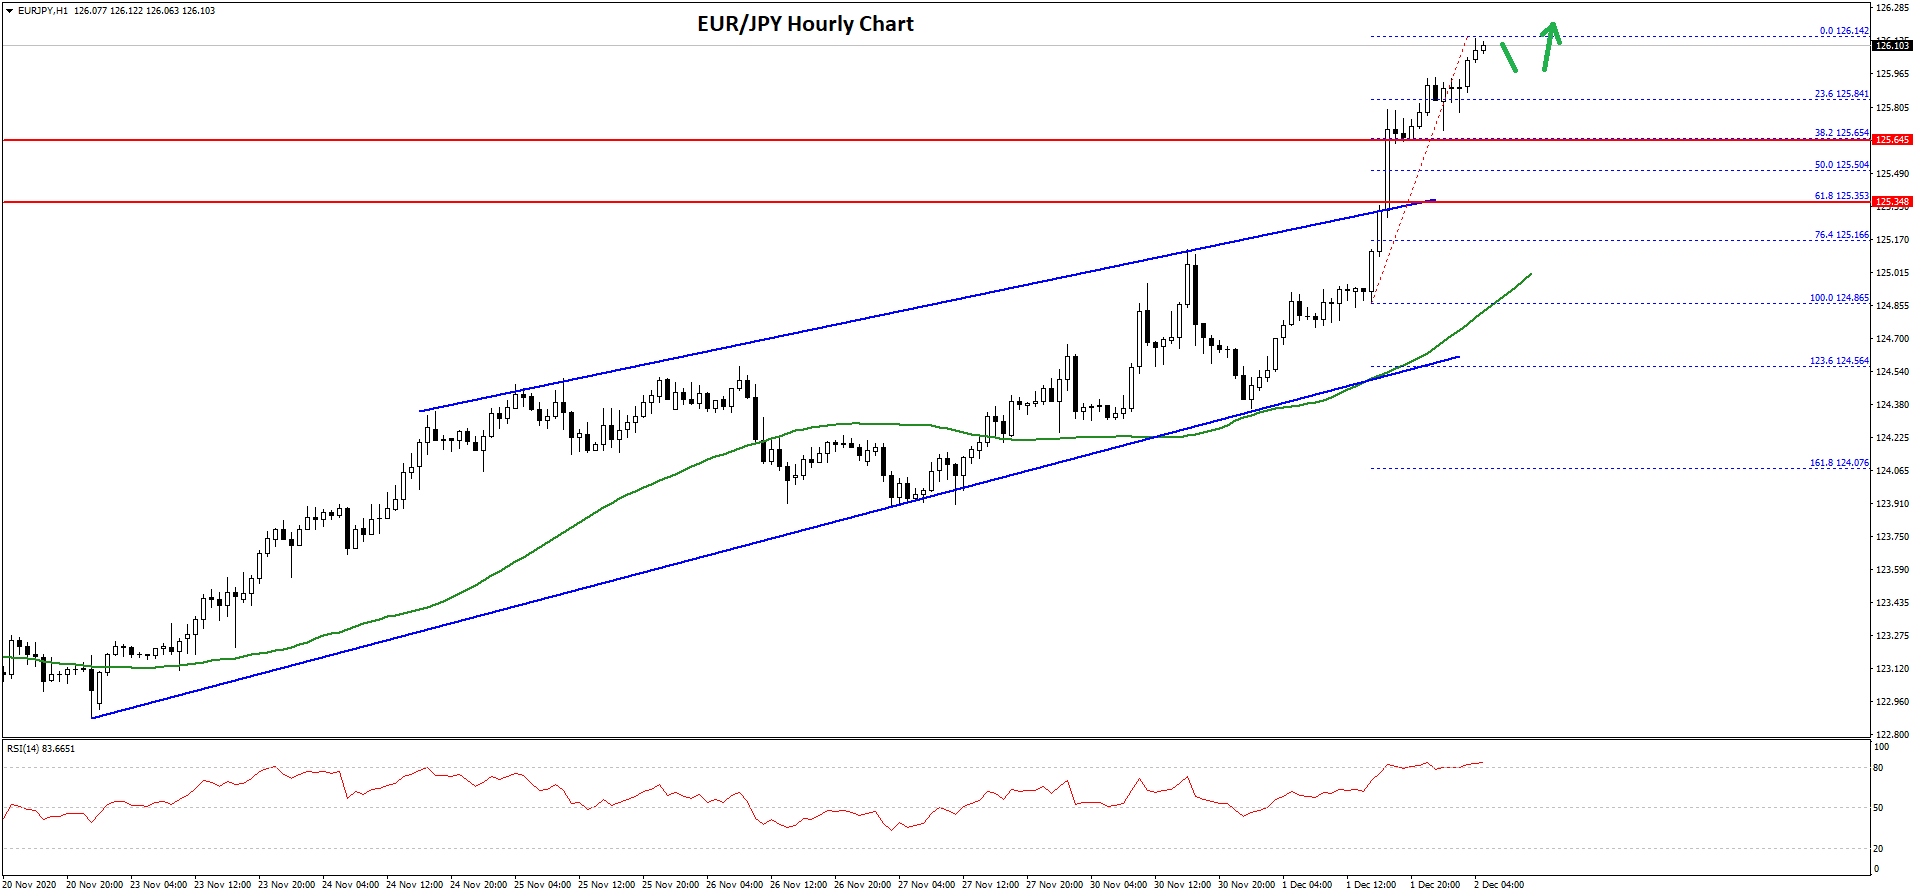
The pair gained strength above the 125.50 level and it even broke the 126.00 level. A high is formed near 126.14 and the pair is currently consolidating gains. An initial support is near the 125.85 level. It is close to the 23.6% Fib retracement level of the recent increase from the 124.86 swing low to 126.14 high.
The next major support is near the 125.65 level (a multi-touch zone). Any more losses could lead the pair towards the 125.50 support. It is close to the 50% Fib retracement level of the recent increase from the 124.86 swing low to 126.14 high.
The main uptrend support seems to be forming near the 125.00 level since it is also close to the 50 hourly simple moving average. On the upside, the pair could accelerate higher if it clears the 126.15 and 126.20 levels.
The next resistance could be near the 126.80 level. Any more upsides might lead the EUR/JPY higher further higher above the 127.00 level. In the stated case, the bulls may possibly aim a larger increase towards the 128.50 and 129.20 resistance levels in the coming days.
Trade over 50 forex markets 24 hours a day with FXOpen. Take advantage of low commissions, deep liquidity, and spreads from 0.0 pips (additional fees may apply). Open your FXOpen account now or learn more about trading forex with FXOpen.
This article represents the opinion of the Companies operating under the FXOpen brand only. It is not to be construed as an offer, solicitation, or recommendation with respect to products and services provided by the Companies operating under the FXOpen brand, nor is it to be considered financial advice.
Stay ahead of the market!
Subscribe now to our mailing list and receive the latest market news and insights delivered directly to your inbox.


Latest articles

EUR/USD Eyes Gains As USD/CHF Weakness Deepens Again
EUR/USD started a fresh increase above 1.1700 and 1.1720. USD/CHF declined further and is now struggling below 0.7835.
Important Takeaways for EUR/USD and USD/CHF Analysis Today
· The Euro started a decent increase from

Apple: Earnings Day Above the Activity Zone
On 30 April, after the market close, Apple Inc. will release its financial results for the second quarter of fiscal 2026. The consensus forecast, based on estimates from 31 analysts, points to revenue of around $109.7 billion, with expected

USD/JPY and USD/CHF Near Key Levels: The Dollar Supported by the Fed
The US dollar continues to trend upwards following the Federal Reserve meeting, drawing support from the regulator’s moderately hawkish stance and comments by Jerome Powell. Markets interpret the Fed’s rhetoric as a signal that restrictive policy is likely