


EUR/USD and EUR/JPY Eye Steady Recovery
FXOpen
EUR/USD started a fresh decline and traded below 1.0500. EUR/JPY is recovering higher and might correct above the 141.20 resistance zone.
Important Takeaways for EUR/USD and EUR/JPY
· The Euro started a major decline from the 1.0780 and 1.0800 resistance levels.
· There is a key bearish trend line forming with resistance near 1.0445 on the hourly chart.
· EUR/JPY formed a base near 139.40 and started an upside correction.
· There is a major bearish trend line forming with resistance near 141.20 on the hourly chart.
EUR/USD Technical Analysis
The Euro failed to clear the 1.0780 resistance against the US Dollar. The EUR/USD pair started a major decline below the 1.0650 and 1.0600 support levels.
There was a clear move below the 1.0550 level and the 50 hourly simple moving average. The pair even settled below the 1.0500 level. A low was formed near 1.0397 on FXOpen and the pair is now consolidating losses.
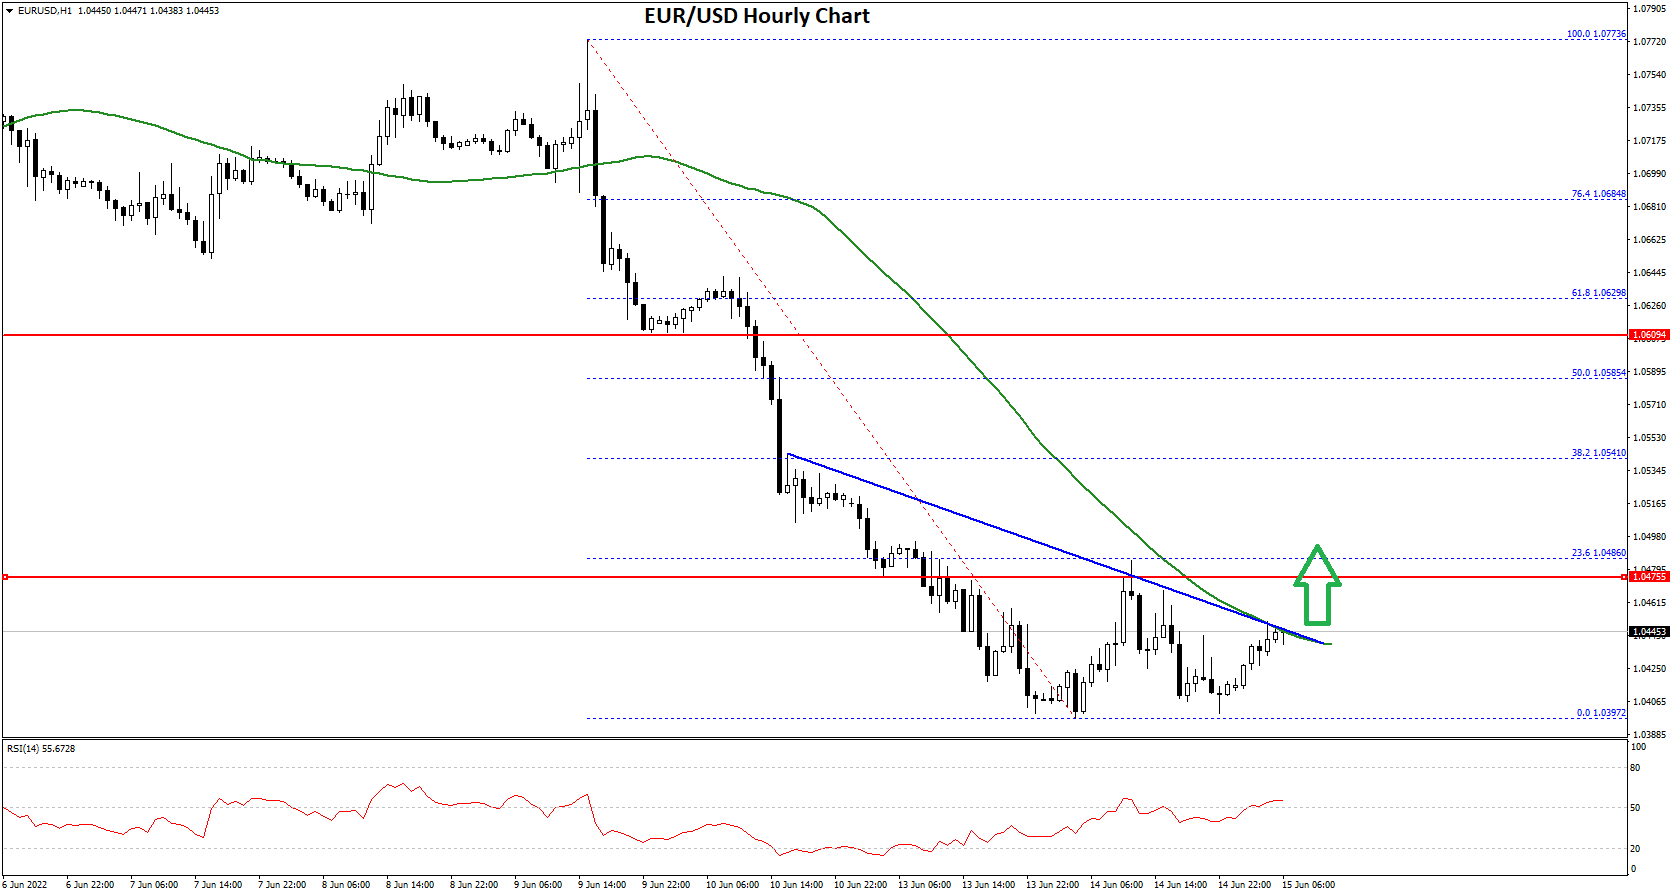
On the upside, the pair is facing resistance near the 1.0445 level. There is also a key bearish trend line forming with resistance near 1.0445 on the hourly chart.
The next major resistance is near the 1.0485 level. It is near the 23.6% Fib retracement level of the downward move from the 1.0773 swing high to 1.0397 low. A clear break above the 1.0485 resistance could push EUR/USD towards 1.0540.
If the bulls remain in action, the pair could revisit the 1.0585 resistance zone in the near term. The 50% Fib retracement level of the downward move from the 1.0773 swing high to 1.0397 low is near the 1.0585 level.
On the downside, the pair might find support near the 1.0420 level. The next major support sits near the 1.0400 level. If there is a downside break below the 1.0400 support, the pair might accelerate lower in the coming sessions.
EUR/JPY Technical Analysis
The Euro also started a fresh decline from the 144.25 resistance against the Japanese Yen. The EUR/JPY pair gained pace and traded below the 142.00 support level.
The pair even broke the 140.00 level and the 50 hourly simple moving average. It traded as low as 139.38 and is currently correcting losses. There was a move above the 23.6% Fib retracement level of the downward move from the 144.24 swing high to 139.38 low.
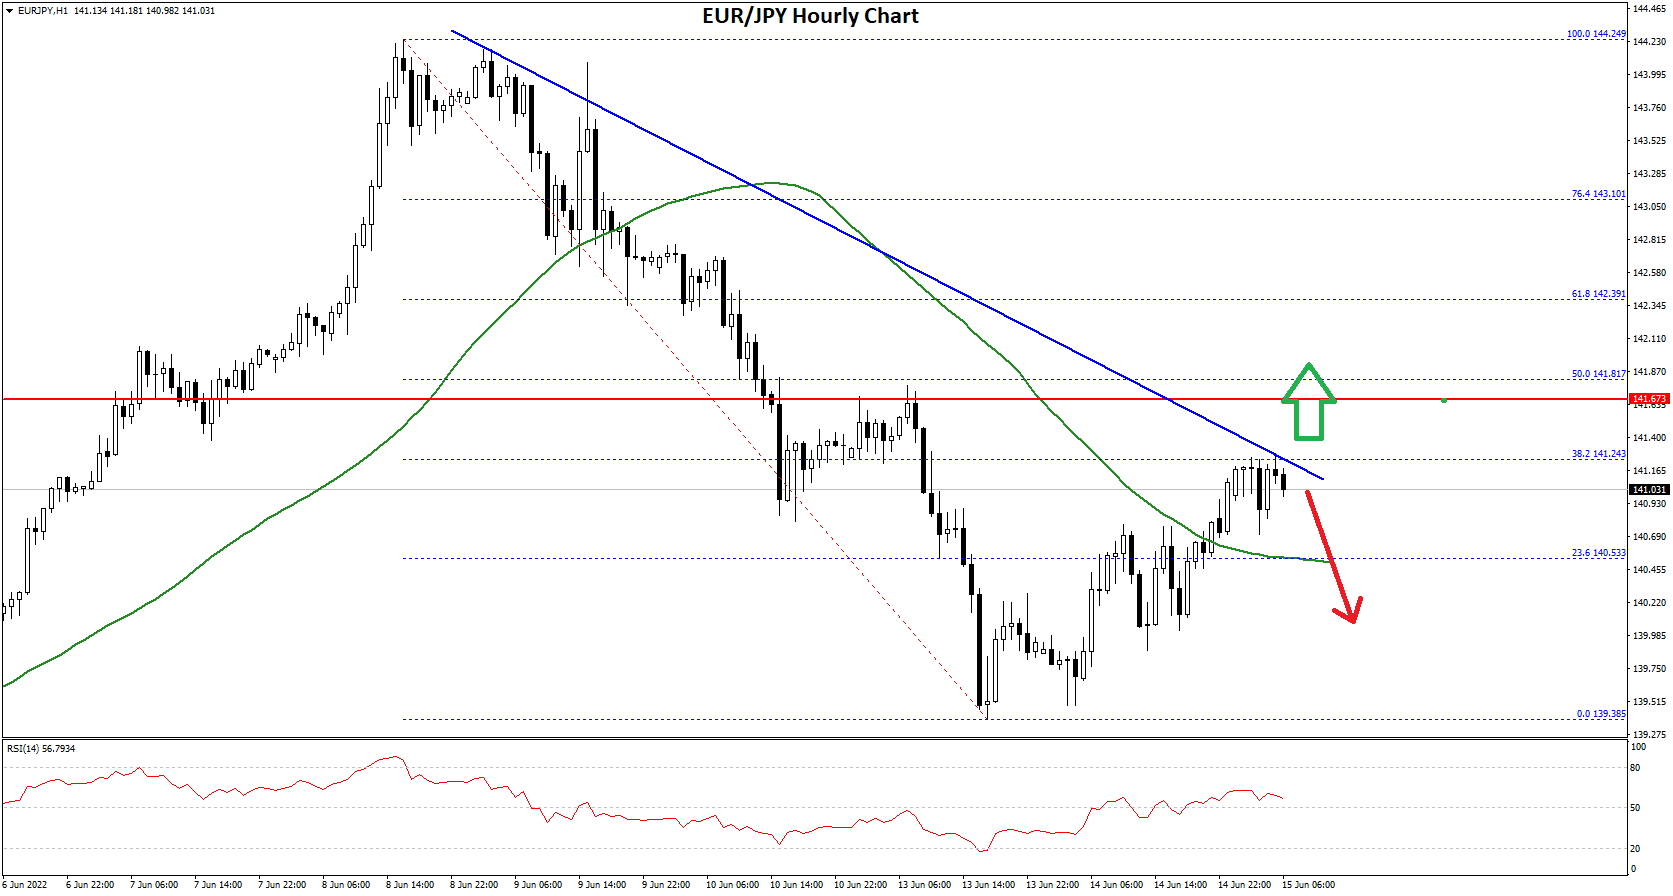
It is now trading near the 144.20 resistance. There is also a major bearish trend line forming with resistance near 141.20 on the hourly chart.
If there is an upside break above the 141.20 resistance, the pair could test the 141.80 resistance. It is near the 50% Fib retracement level of the downward move from the 144.24 swing high to 139.38 low. The next major resistance could be near the 142.50 level, above which the pair could gain bullish momentum. In the stated case, the pair could rise towards the 143.50 level.
If not, the pair could start a fresh decline below the 140.50 support. The next major support is near the 140.00 level. The main support sits near the 139.40 level. Any more losses could lead the pair towards the 138.00 support level in the near term.
This forecast represents FXOpen Markets Limited opinion only, it should not be construed as an offer, invitation or recommendation in respect to FXOpen Markets Limited products and services or as financial advice.
Trade over 50 forex markets 24 hours a day with FXOpen. Take advantage of low commissions, deep liquidity, and spreads from 0.0 pips (additional fees may apply). Open your FXOpen account now or learn more about trading forex with FXOpen.
This article represents the opinion of the Companies operating under the FXOpen brand only. It is not to be construed as an offer, solicitation, or recommendation with respect to products and services provided by the Companies operating under the FXOpen brand, nor is it to be considered financial advice.
Stay ahead of the market!
Subscribe now to our mailing list and receive the latest market news and insights delivered directly to your inbox.


Latest articles

EUR/USD: All Eyes on the Fed as the Range Reaches Its Breaking Point
The dollar's next move hinges on tonight's Fed decision, and this time markets genuinely don't know what to expect. While economists still lean toward a hold—with CME FedWatch odds sitting near 68.5% for no change—Kevin Warsh's hawkish

USD/JPY and USD/CAD Test Resistance Ahead of Fresh Fed Signals
The US dollar continues to hold the upper hand against most major currencies ahead of the outcome of the latest Federal Reserve meeting. While the base-case scenario remains for interest rates to stay unchanged, markets are also pricing in the

Amazon Earnings: Does the Chart Already Know Something the Numbers Don't?
All eyes are on July 30, when Amazon reports Q2 2026 earnings, with Wall Street increasingly convinced the bar has been set too low. Consensus sees EPS near $1.82-$2.26 on roughly $197 billion in revenue, but the