


FXOpen

EUR/USD started a decent upward move above 1.1250, but it is facing hurdles near 1.1350. EUR/JPY is also trading in a positive zone, but it must surpass 121.00 for more gains.
Important Takeaways for EUR/USD and EUR/JPY
- The Euro is trading with a bullish bias above the 1.1250 and 1.1280 resistance levels.
- There is a connecting bullish trend line forming with support near 1.1305 on the hourly chart of EUR/USD.
- EUR/JPY settled nicely above the 120.00 and 120.20 support levels.
- There is a key bearish trend line forming with resistance near 120.90 on the hourly chart.
EUR/USD Technical Analysis
After forming a support base above 1.1200, the Euro started a decent increase against the US Dollar. The EUR/USD pair traded above the 1.1250 resistance zone to enter an uptrend.
The pair even surpassed the 1.1300 resistance level and the 50 hourly simple moving average. However, the bulls struggled to clear the 1.1350 resistance zone. A high is formed near 1.1348 on FXOpen and the pair is currently correcting lower.
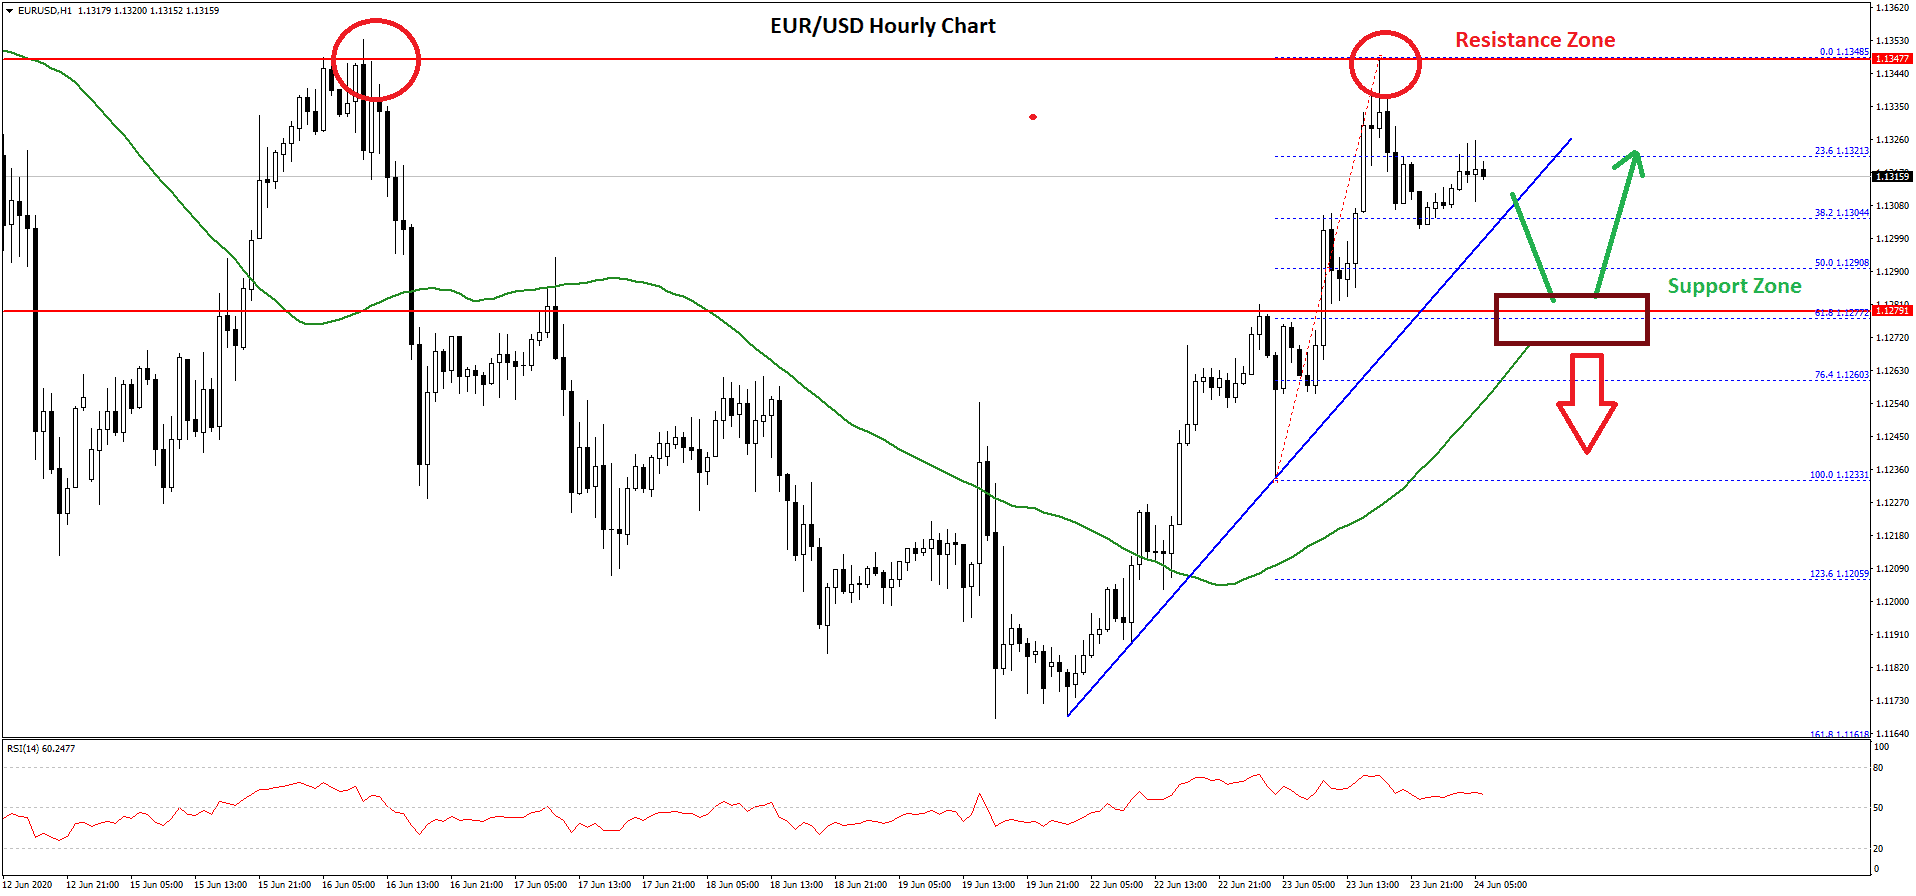
There was a break below the 23.6% Fib retracement level of the recent wave from the 1.1233 low to 1.1348 high. On the downside, there is a short-term support forming near the 1.1300 level.
There is also a connecting bullish trend line forming with support near 1.1305 on the hourly chart of EUR/USD. If there is a break below the trend line, the pair could continue to move down towards the 1.1280 support area.
An intermediate support is near the 1.1290 level, which is the 50% Fib retracement level of the recent wave from the 1.1233 low to 1.1348 high.
If the pair fails to stay above the 1.1280 support and the 50 hourly simple moving average, there could be heavy losses in the coming sessions. Conversely, the pair could start a fresh increase above the 1.1320 resistance level. A successful close above the 1.1350 resistance could open the doors for more upsides towards 1.1400 in the near term.
EUR/JPY Technical Analysis
The Euro traded below the 120.00 support this past week against the Japanese Yen. The EUR/JPY pair traded as low as 119.30 before it started a steady recovery wave.
There was a break above the 120.00 resistance zone and the 50 hourly simple moving average. The pair traded as high as 121.10 and recently corrected lower. It tested the 38.2% Fib retracement level of the upward move from the 119.30 low to 121.10 high.
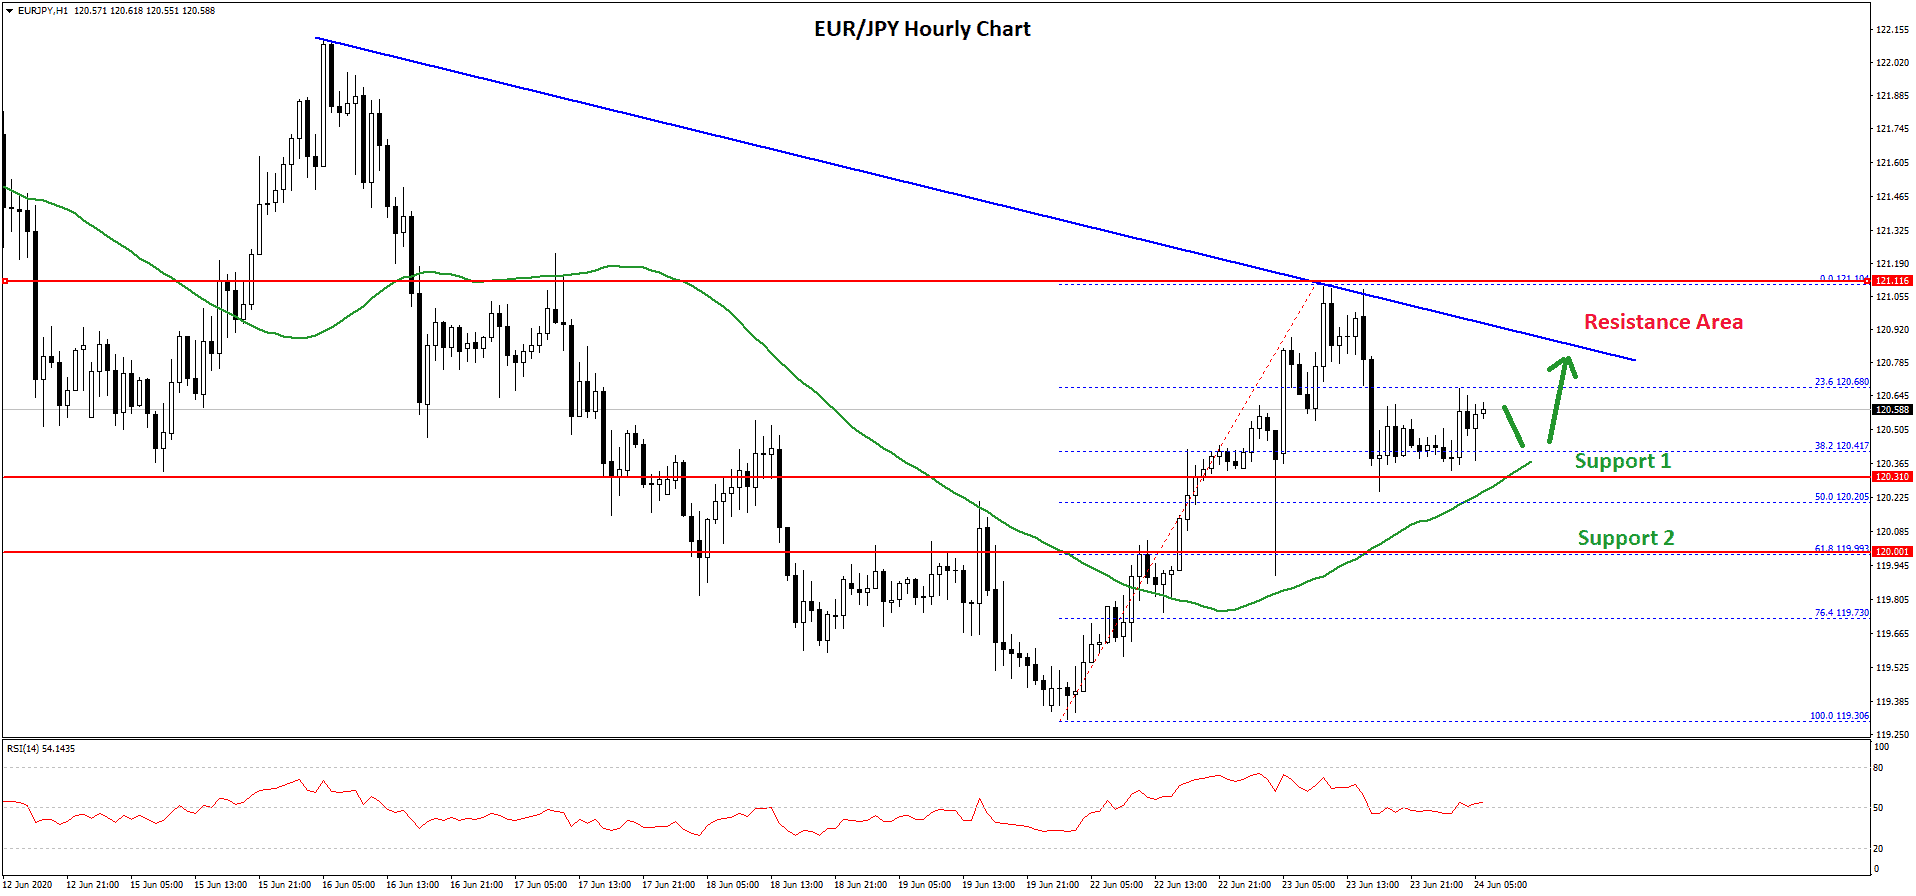
However, the 130.30 region is acting as a support along with the 50 hourly simple moving average. The 50% Fib retracement level of the upward move from the 119.30 low to 121.10 high is also near the 120.30 level to provide a strong support.
On the upside, there is a key bearish trend line forming with resistance near 120.90 on the hourly chart. If the pair fails to continue higher above the trend line resistance and 121.00, it could continue to move down.
The first major support below 120.30 is near the 120.00 level. Any further losses may perhaps lead the pair towards the 119.50 level. Conversely, EUR/JPY might continue to rise above the 121.00 and 121.10 resistance levels. The next major resistance is near the 122.00 level.
Trade over 50 forex markets 24 hours a day with FXOpen. Take advantage of low commissions, deep liquidity, and spreads from 0.0 pips. Open your FXOpen account now or learn more about trading forex with FXOpen.
This article represents the opinion of the Companies operating under the FXOpen brand only. It is not to be construed as an offer, solicitation, or recommendation with respect to products and services provided by the Companies operating under the FXOpen brand, nor is it to be considered financial advice.
Stay ahead of the market!
Subscribe now to our mailing list and receive the latest market news and insights delivered directly to your inbox.

Latest from Forex Analysis
Latest articles

Weekly Market Wrap With Gary Thomson: Nasdaq, EUR/USD, USD/CHF, Brent Crude Oil, Googl Shares
Get the latest scoop on the week's hottest headlines, all in one convenient video. Join Gary Thomson, the COO of FXOpen UK, as he breaks down the most significant news reports and shares his expert insights.
- Nasdaq Composite: Worst Session

Analysis of AUD/USD: Exchange Rate Falls to Early May Low
As indicated by the 4-hour AUD/USD chart today:
→ the rate fell below 0.652, a level last seen on May 2;
→ the RSI indicator dropped below 15, a level last seen during the panic over the spread of COVID-19

Analysis of AMZN Stock: Price at 1.5-Month Low
As shown in the AMZN chart, the stock price dropped below:
→ the psychological level of $180;
→ the mid-June interim low.
The last time AMZN traded below $180 was in early June.
Thus, AMZN has faced sell-offs, similar to other tech