


EUR/USD and USD/CHF Could Extend Declines
FXOpen
EUR/USD recovered recently, but it failed to break the 1.1480 resistance. USD/CHF declined heavily and cleared the 0.9900 support area to move into a bearish zone.
Important Takeaways for EUR/USD and USD/CHF
- The Euro recovered nicely above the 1.1400 resistance before sellers appeared near 1.1480 against the US Dollar.
- There is a major bearish trend line formed with resistance at 1.1400 on the hourly chart of EUR/USD.
- USD/CHF declined heavily and broke the 0.9900 support area.
- The pair is facing a solid bearish trend line with current resistance at 0.9940 on the hourly chart.
EUR/USD Technical Analysis
The Euro formed a support near the 1.1275 level against the US Dollar. The EUR/USD pair traded above the 1.1390, 1.1400 and 1.1440 resistance levels to move into a positive zone.
However, the pair struggled to gain pace above 1.1480, formed a high at 1.1482 on FXOpen, and later started a downside move. It broke the 1.1440 support level and the 50 hourly simple moving average.
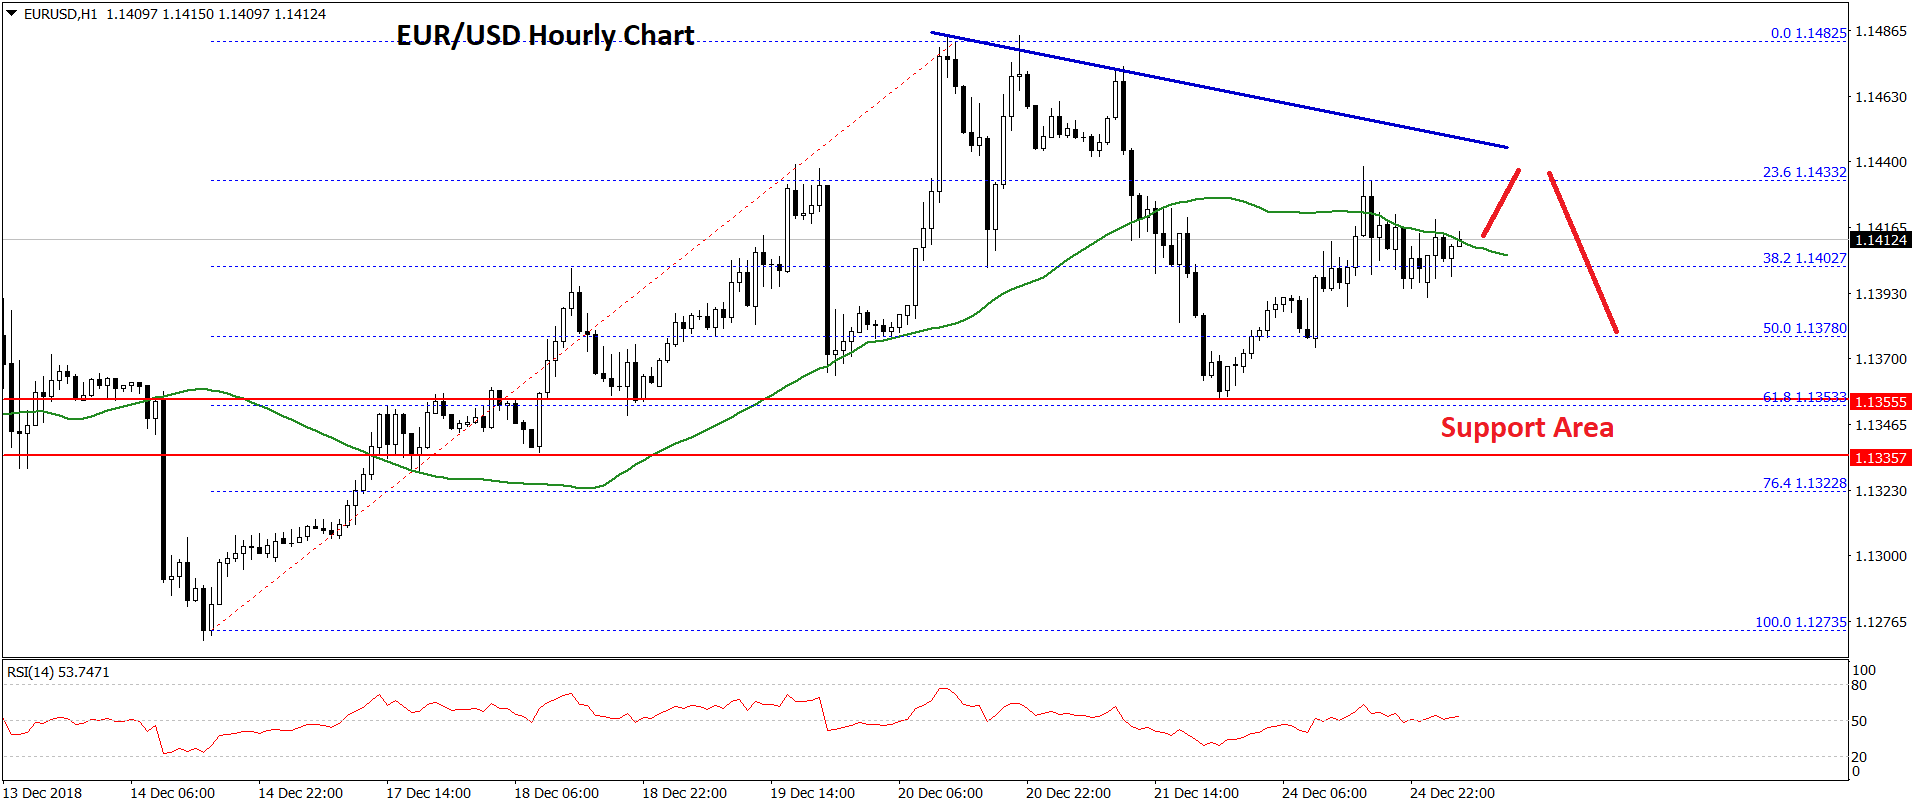
More importantly, there was a break below the 50% Fib retracement level of the last wave from the 1.1273 low to 1.1482 swing high. On the downside, the 1.1350-1.1355 zone acted as a decent support and prevented more losses.
Moreover, the 61.8% Fib retracement level of the last wave from the 1.1273 low to 1.1482 swing high is also near the 1.1350 level to act as a solid support.
On the upside, the pair is facing a crucial resistance near the 1.1430 and 1.1440 levels. Besides, there is a major bearish trend line formed with resistance at 1.1400 on the hourly chart of EUR/USD. Therefore, it won’t be easy for buyers to clear the 1.1440 resistance area.
If there is no break above 1.1440, there is a risk of more losses in EUR/USD below the 1.1350 support.
USD/CHF Technical Analysis
The US Dollar formed a major top near the 0.9980 level and started a downside move against the Swiss franc. The USD/CHF pair declined heavily and broke the 0.9950 and 0.9920 support levels.
More importantly, there was a break below the 0.9900 support and the 50 hourly simple moving average. Finally, the pair breached the 76.4% Fib retracement level of the recent wave from the 0.9840 low to 0.9956 high.
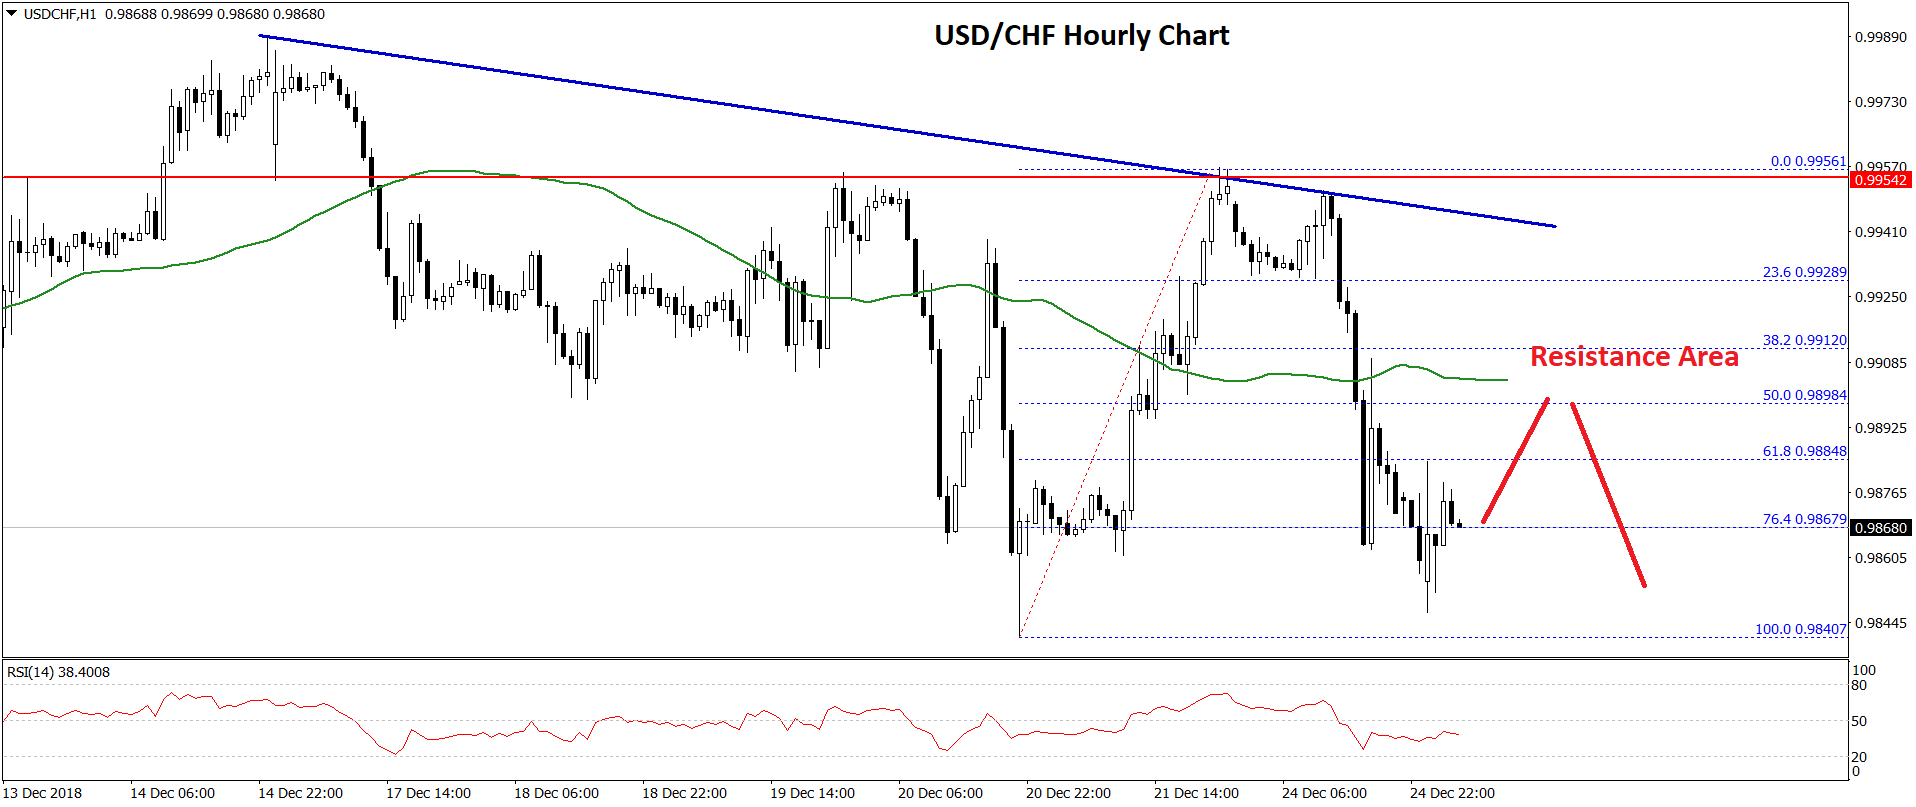
If the current decline extends below the 0.9840 swing low, there could be a test of the 0.9800 support level. An intermediate support is near the 1.236 Fib extension level of the recent wave from the 0.9840 low to 0.9956 high.
On the upside, an initial resistance is near the 0.9915 level. Besides, the pair is facing a solid bearish trend line with current resistance at 0.9940 on the hourly chart.
Therefore, an upward move in USD/CHF towards the 0.9915 and 0.9930 levels are likely to face a solid selling interest in the near term. Only a successful close above the trend line and the 0.9940 level could open the doors for trend change in the near term.
Overall, sellers remain in action and there could be more losses below 0.9840 and 0.9820 in the coming sessions. The key resistances are 0.9915, 0.9930 and 0.9940.
Trade over 50 forex markets 24 hours a day with FXOpen. Take advantage of low commissions, deep liquidity, and spreads from 0.0 pips (additional fees may apply). Open your FXOpen account now or learn more about trading forex with FXOpen.
This article represents the opinion of the Companies operating under the FXOpen brand only. It is not to be construed as an offer, solicitation, or recommendation with respect to products and services provided by the Companies operating under the FXOpen brand, nor is it to be considered financial advice.
Stay ahead of the market!
Subscribe now to our mailing list and receive the latest market news and insights delivered directly to your inbox.


Latest articles

US Dollar Strengthens Amid Equity Market Weakness and Hawkish Fed Rhetoric
The US dollar continues to hold firm near multi-year highs as sentiment across equity markets deteriorates and investors increasingly expect the Federal Reserve to maintain a restrictive monetary policy stance for longer. The US economy remains resilient, while inflation risks

Bitcoin: Corrective Channel Broken as Traders Turn More Active
Bitcoin has come under the influence of several factors simultaneously. The wave of selling at the beginning of June was linked to Strategy's first disclosed Bitcoin sale in several years, a prolonged series of outflows from spot ETFs, and a

DAX 40: consolidation amid technology sell-off
A wave of selling in the technology sector that emerged earlier this week has weighed on European equities. The trigger was investor concern over the profitability of large-scale debt-funded investments by major US tech companies in AI infrastructure. The Nasdaq