


FXOpen
EUR/USD declined heavily and broke the 1.1240 support area before finding buyers near 1.1180. USD/CHF remained in a positive zone and dips remain supported near 0.9965.
Important Takeaways for EUR/USD and USD/CHF
- The Euro faced a solid rise in selling pressure below the 1.1320 support against the US Dollar.
- There is a major declining channel in place with resistance near 1.1230 on the hourly chart of EUR/USD.
- USD/CHF climbed higher recently above the 0.9950 and 0.9980 resistance levels.
- There is a major bullish trend line formed with support at 0.9960 on the hourly chart.
EUR/USD Technical Analysis
The Euro started a significant downside move from well above the 1.1350 level against the US Dollar. The EUR/USD pair broke the 1.1320 and 1.1240 support levels to enter a major downtrend.
The decline was such that the pair even broke the 1.1220 support area and settled below the 50 hourly simple moving average. The pair traded as low as 1.1183 on FXOpen and it is currently correcting higher.
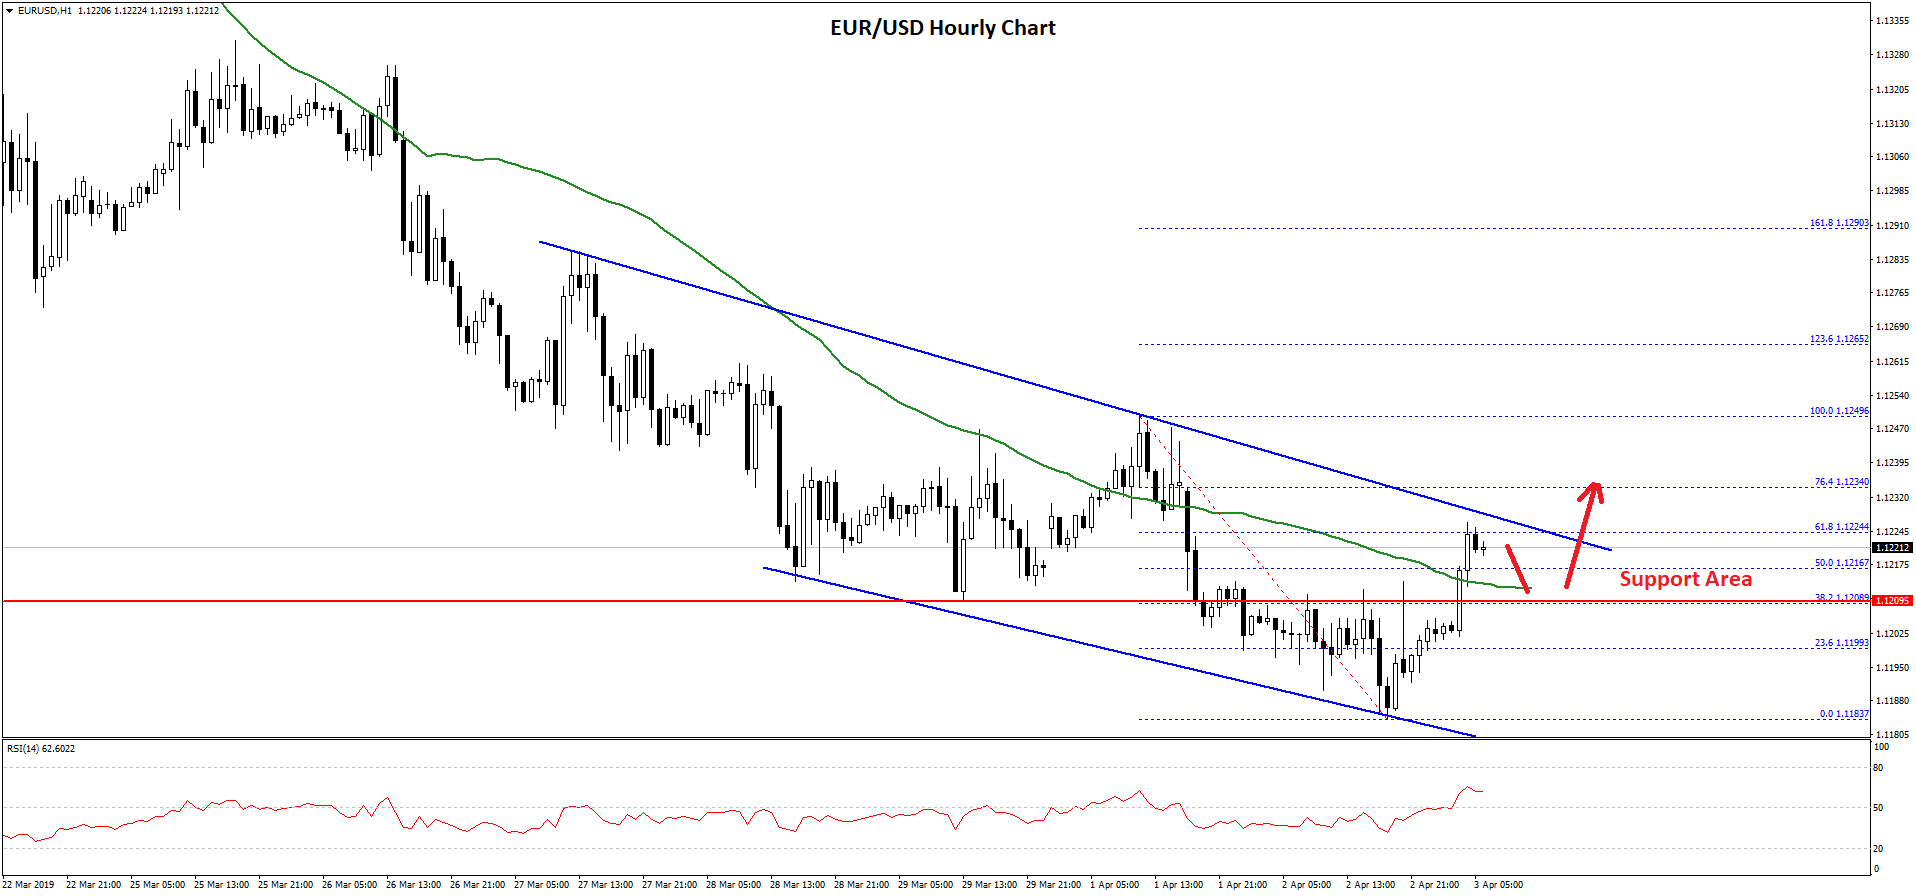
Buyers managed to push the price above the 50% Fib retracement level of the recent decline from the 1.1249 high to 1.1183 low. Moreover, there was a break above the 1.1210 resistance level and the 50 hourly simple moving average.
It is currently trading near the 61.8% Fib retracement level of the recent decline from the 1.1249 high to 1.1183 low. There is also a major declining channel in place with resistance near 1.1230 on the hourly chart of EUR/USD.
A break above the channel resistance near the 1.1225 and 1.1230 resistance levels may call for more upsides in the near term. On the upside, the next major resistance is near the 1.1250 level.
On the downside, there is a decent support formed near the 1.1200-1.1210 zone. If there is a close below 1.1200, the pair might move back towards the 1.1180 and 1.1160 levels.
USD/CHF Technical Analysis
The US Dollar started a solid upward move from the 0.9900-0.9910 support area against the Swiss franc. The USD/CHF pair traded above the 0.9940 and 0.9950 resistance levels to move into a positive zone.
Buyers gained control and pushed the pair above the 0.9980 resistance and the 50 hourly simple moving average. The pair traded close the 1.0000 resistance and formed a high at 0.9999. Later, there was a downside correction below the 0.9985 support.
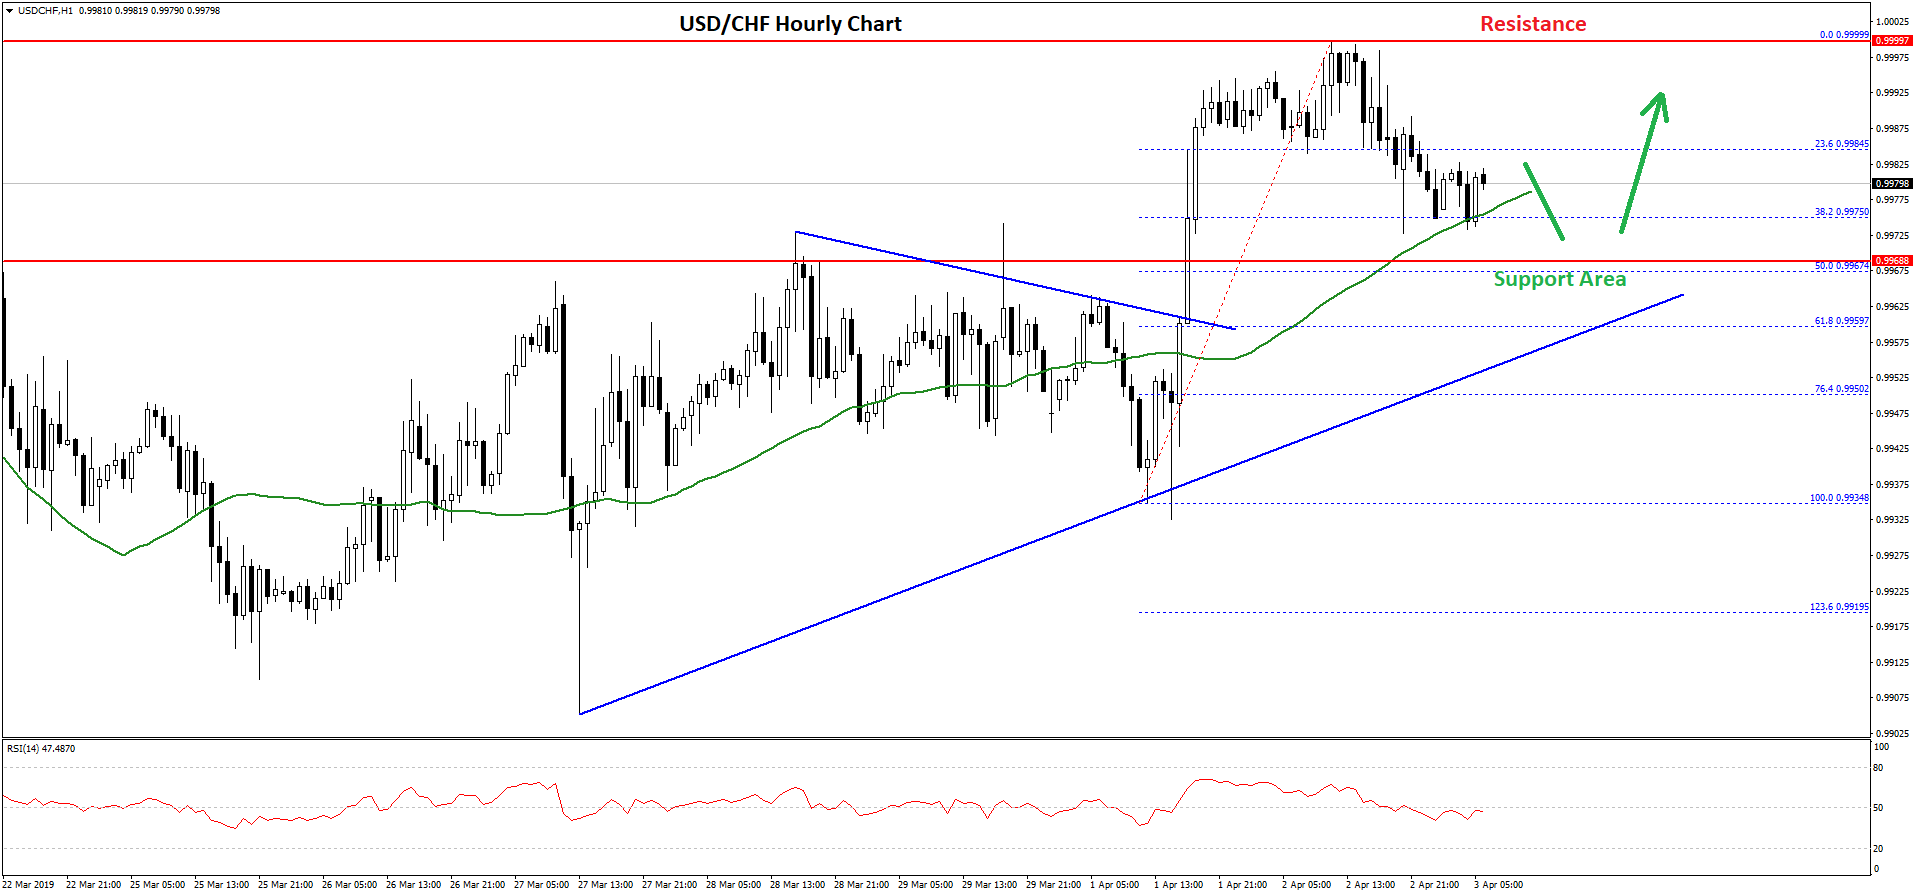
The pair broke the 23.6% Fib retracement level of the recent wave from the 0.9934 low to 0.9999 high. However, the 0.9875 support and the 50 hourly simple moving average is currently acting as a support.
The next key support is near the 0.9965 level. It coincides with the previous resistance zone and the 50% Fib retracement level of the recent wave from the 0.9934 low to 0.9999 high.
Therefore, if the pair corrects further, it is likely to find a strong buying interest near the 0.9965 support area in the coming sessions. Below 0.9965, the next key support is near the 0.9940 level.
On the upside, the main resistance is near the 1.0000 area, where sellers are likely to take a stand. An upside break above 1.0000 might call for more gains towards the 1.0025 and 1.0050 levels.
Trade over 50 forex markets 24 hours a day with FXOpen. Take advantage of low commissions, deep liquidity, and spreads from 0.0 pips. Open your FXOpen account now or learn more about trading forex with FXOpen.
This article represents the opinion of the Companies operating under the FXOpen brand only. It is not to be construed as an offer, solicitation, or recommendation with respect to products and services provided by the Companies operating under the FXOpen brand, nor is it to be considered financial advice.
Stay ahead of the market!
Subscribe now to our mailing list and receive the latest market news and insights delivered directly to your inbox.

Latest from Forex Analysis
Latest articles

Weekly Market Wrap With Gary Thomson: Nasdaq, EUR/USD, USD/CHF, Brent Crude Oil, Googl Shares
Get the latest scoop on the week's hottest headlines, all in one convenient video. Join Gary Thomson, the COO of FXOpen UK, as he breaks down the most significant news reports and shares his expert insights.
- Nasdaq Composite: Worst Session

Analysis of AUD/USD: Exchange Rate Falls to Early May Low
As indicated by the 4-hour AUD/USD chart today:
→ the rate fell below 0.652, a level last seen on May 2;
→ the RSI indicator dropped below 15, a level last seen during the panic over the spread of COVID-19

Analysis of AMZN Stock: Price at 1.5-Month Low
As shown in the AMZN chart, the stock price dropped below:
→ the psychological level of $180;
→ the mid-June interim low.
The last time AMZN traded below $180 was in early June.
Thus, AMZN has faced sell-offs, similar to other tech