


FXOpen

EUR/USD is currently attempting an upside correction from the 1.0998 low, but it is facing hurdles near 1.1020. Similarly, USD/JPY must surpass 109.25 to start a decent recovery in the near term.
Important Takeaways for EUR/USD and USD/JPY
- The Euro declined heavily before it found support near the 1.0000 area.
- There was a break above a key bearish trend line with resistance near 1.1018 on the hourly chart of EUR/USD.
- USD/JPY is recovering higher from the 108.80 support and tested 109.25.
- There was a break above a major bearish trend line with resistance near 109.15 on the hourly chart.
EUR/USD Technical Analysis
In the past few days, the Euro declined heavily below the 1.1085 and 1.1050 support levels against the US Dollar. The EUR/USD pair broke the 1.1040 support level to enter a bearish zone.
Moreover, there was a close below the 1.1040 level and the 50 hourly simple moving average. A low is formed at 1.0998 on FXOpen and the pair is currently correcting higher.
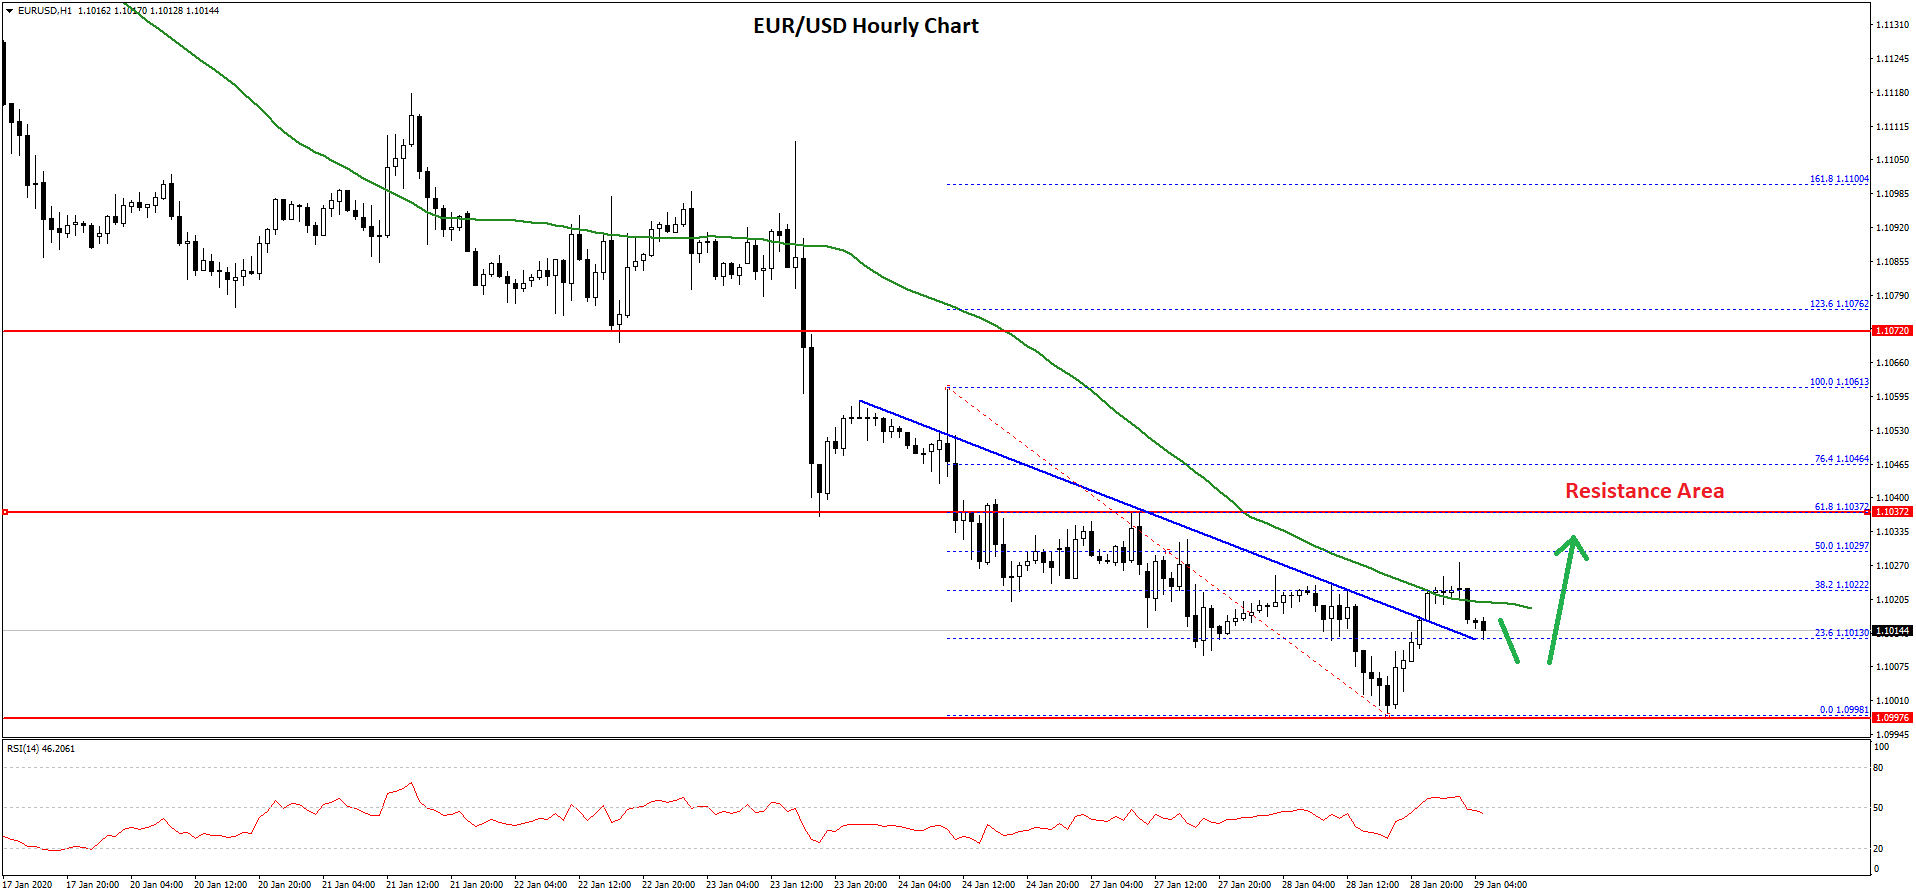
It broke the 1.1010 level, plus the 23.6% Fib retracement level of the recent decline from the 1.1061 high to 1.0998 low. Moreover, there was a break above a key bearish trend line with resistance near 1.1018 on the hourly chart of EUR/USD.
However, the pair is currently struggling to clear the 1.1020 and 1.1025 resistance levels. Besides, the 50 hourly SMA is protecting gains. Therefore, a clear break above the 1.1025 level is needed for more upsides.
The next major resistance is near the 1.1040 level. An intermediate resistance is the 50% Fib retracement level of the recent decline from the 1.1061 high to 1.0998 low.
If the bulls are able to push the pair above the 1.1040 level, there are chances of decent gains towards the 1.1060 and 1.1080 levels.
On the downside, the 1.0000 support area holds the key. If there is a daily close below 1.1000, EUR/USD is likely to continue lower towards the 1.0960 support level in the near term.
USD/JPY Technical Analysis
The US Dollar declined heavily from well above the 110.00 level against the Japanese Yen. The USD/JPY pair broke many supports near the 109.65 and 109.25 levels to enter a bearish zone.
Moreover, there was a close below the 109.50 level and the 50 hourly simple moving average. A low was formed near 108.73 and the pair is currently correcting higher.
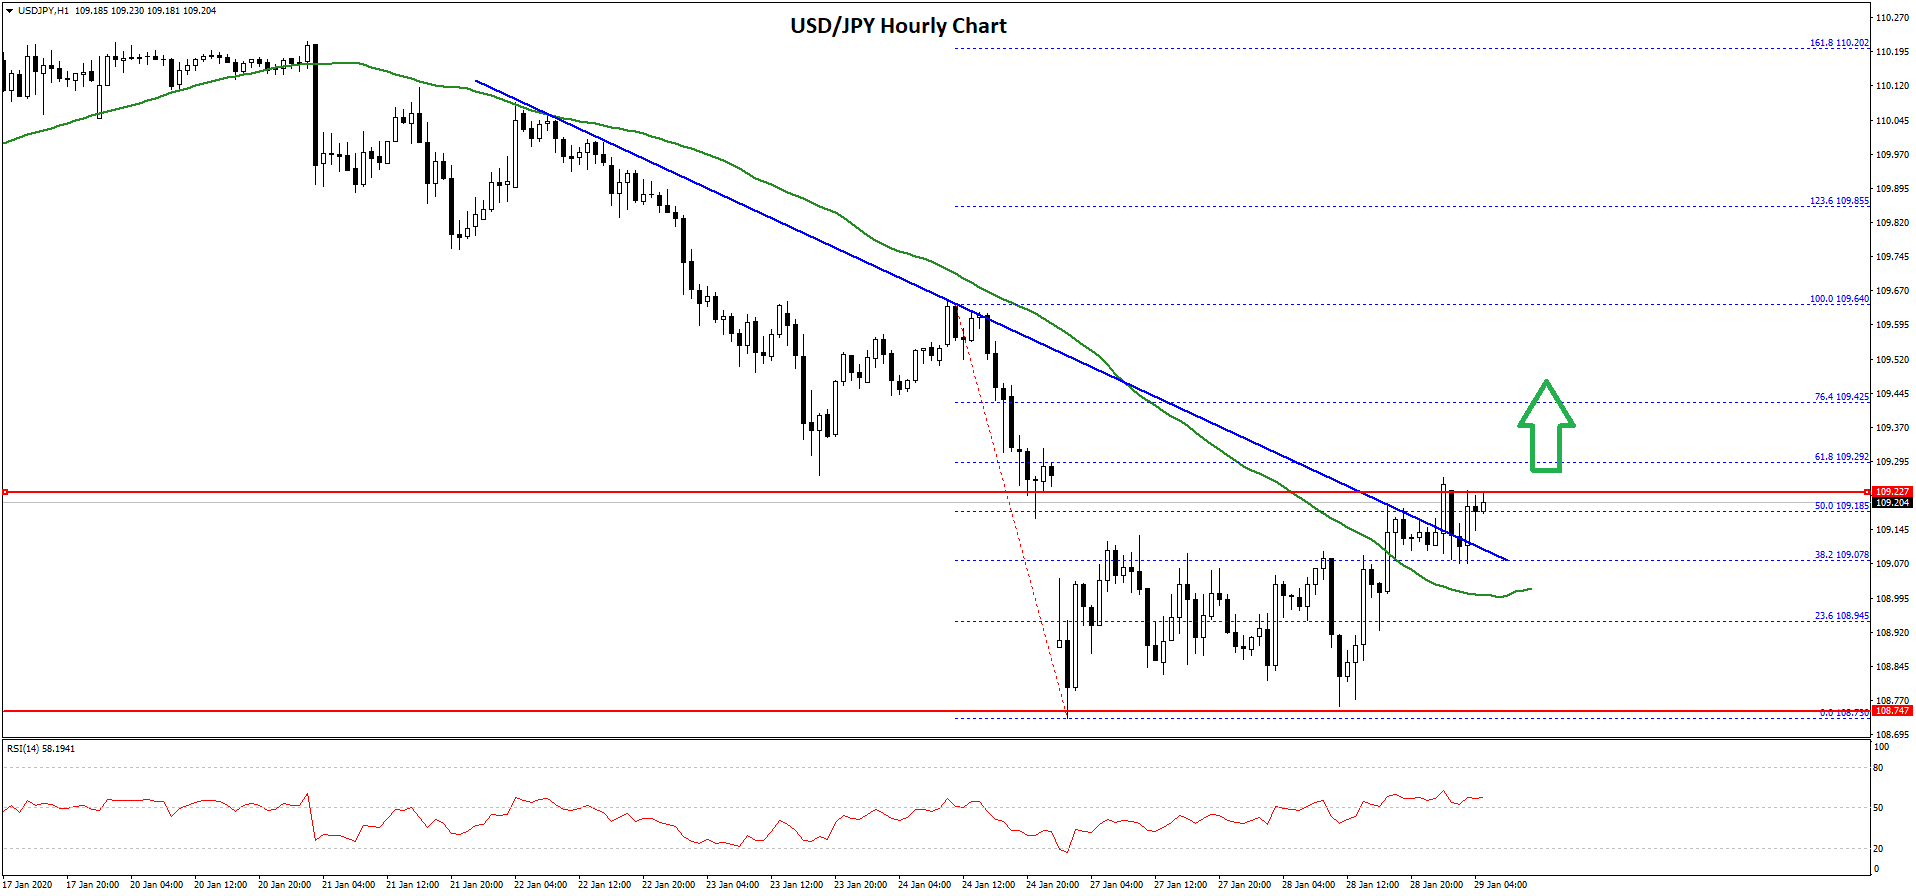
It climbed above the 109.00 resistance area. Besides, there was a break above a major bearish trend line with resistance near 109.15 on the hourly chart. The pair broke the 38.2% Fib retracement level of the recent decline from the 109.64 high to 108.73 low.
However, the pair is facing hurdles near the 109.25 and 109.30 levels. It seems like the 50% Fib retracement level of the recent decline from the 109.64 high to 108.73 low is protecting gains.
Therefore, a clear break above the 109.25 resistance is needed for more gains. If the pair settles above 109.30, it could start a fresh increase towards the 109.65 and 109.80 levels.
On the other hand, USD/JPY might fail to continue above the 109.25 resistance. In the stated scenario, it could resume its decline below the 109.00 and 108.80 levels in the coming sessions.
Trade over 50 forex markets 24 hours a day with FXOpen. Take advantage of low commissions, deep liquidity, and spreads from 0.0 pips. Open your FXOpen account now or learn more about trading forex with FXOpen.
This article represents the opinion of the Companies operating under the FXOpen brand only. It is not to be construed as an offer, solicitation, or recommendation with respect to products and services provided by the Companies operating under the FXOpen brand, nor is it to be considered financial advice.
Stay ahead of the market!
Subscribe now to our mailing list and receive the latest market news and insights delivered directly to your inbox.

Latest from Forex Analysis
Latest articles

Weekly Market Wrap With Gary Thomson: Nasdaq, EUR/USD, USD/CHF, Brent Crude Oil, Googl Shares
Get the latest scoop on the week's hottest headlines, all in one convenient video. Join Gary Thomson, the COO of FXOpen UK, as he breaks down the most significant news reports and shares his expert insights.
- Nasdaq Composite: Worst Session

Analysis of AUD/USD: Exchange Rate Falls to Early May Low
As indicated by the 4-hour AUD/USD chart today:
→ the rate fell below 0.652, a level last seen on May 2;
→ the RSI indicator dropped below 15, a level last seen during the panic over the spread of COVID-19

Analysis of AMZN Stock: Price at 1.5-Month Low
As shown in the AMZN chart, the stock price dropped below:
→ the psychological level of $180;
→ the mid-June interim low.
The last time AMZN traded below $180 was in early June.
Thus, AMZN has faced sell-offs, similar to other tech