


EUR/USD and USD/JPY: Dollar Bulls Might Struggle
FXOpen
EUR/USD rebounded recently and climbed above the 1.1250 resistance area. USD/JPY is currently declining and it may continue to slide towards the 110.90 support area.
Important Takeaways for EUR/USD and USD/JPY
- The Euro managed to recover above the 1.1220 and 1.1250 resistance levels.
- There is a crucial bullish trend line in place with support at 1.1255 on the hourly chart of EUR/USD.
- USD/JPY started a solid downside move from well above the 111.80 level.
- There is a declining channel in place with resistance near the 111.30 on the hourly chart.
EUR/USD Technical Analysis
After a major drop, the Euro found a strong buying interest near the 1.1180 and 1.1185 levels against the US Dollar. The EUR/USD pair started a substantial recovery and climbed above the 1.1220 and 1.1250 resistance levels.
There was even a close above the 1.1250 level and the 50 hourly simple moving average. The pair broke the 1.1280 level and traded as high as 1.1284 on FXOpen. Later, there was a downside correction below the 1.1265 level.
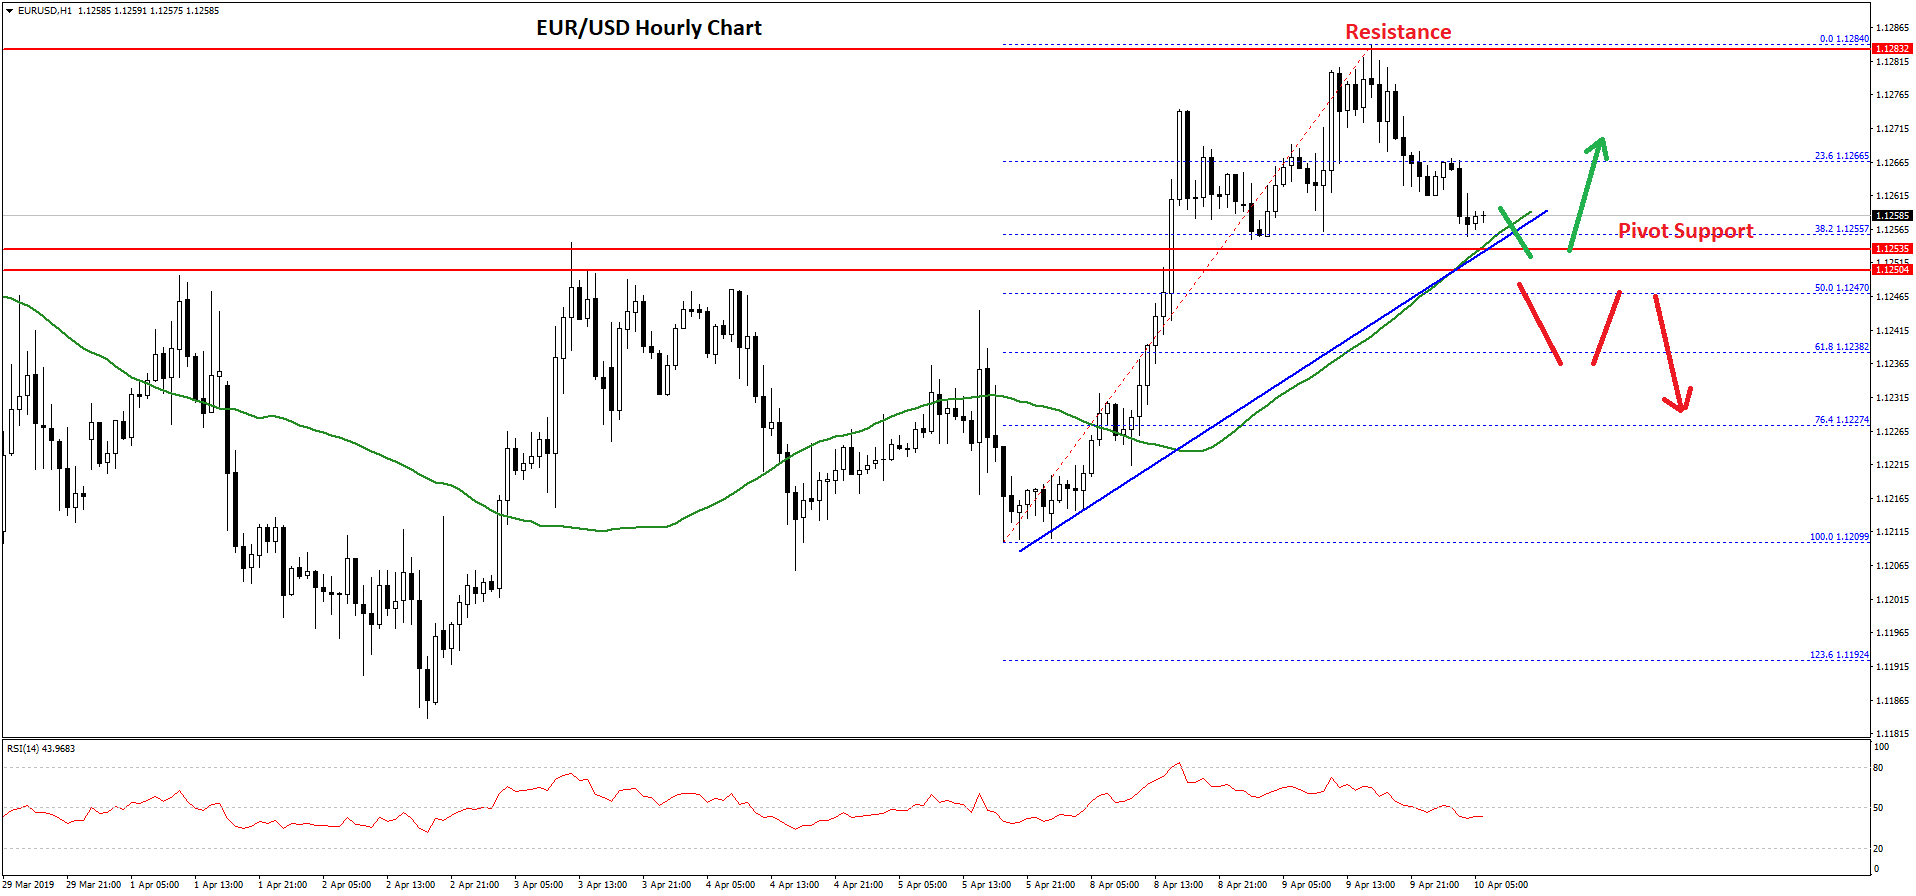
The pair traded below the 23.6% Fib retracement level of the recent wave from the 1.1209 low to 1.1284 high. However, the previous resistance near the 1.1255 level is acting as a solid support.
There is also a crucial bullish trend line in place with support at 1.1255 on the hourly chart of EUR/USD. The trend line coincides with the 50 hourly simple moving average and the 50% Fib retracement level of the recent wave from the 1.1209 low to 1.1284 high.
Therefore, the pair is likely to bounce back as long as it is above the 1.1255 and 1.1250 support levels. An initial resistance is near the 1.1265 level, above which the price could trade towards the 1.1285 level.
On the downside, if there is a successful close below the 1.1250 support, EUR/USD might slide towards the 1.1220 support level in the near term. The next main support is at 1.1200, where bulls may emerge.
USD/JPY Technical Analysis
The US Dollar faced a strong resistance near the 111.80 zone and recently declined against the Japanese Yen. The USD/JPY pair traded below the 111.60 and 111.20 support levels to move into a bearish zone.
The pair even settled below the 111.20 level and the 50 hourly simple moving average. It traded as low as 110.98 before starting an upside correction. Bulls pushed the pair above the 111.10 level and the 23.6% Fib retracement level of the last decline from the 111.57 high to 110.98 low.
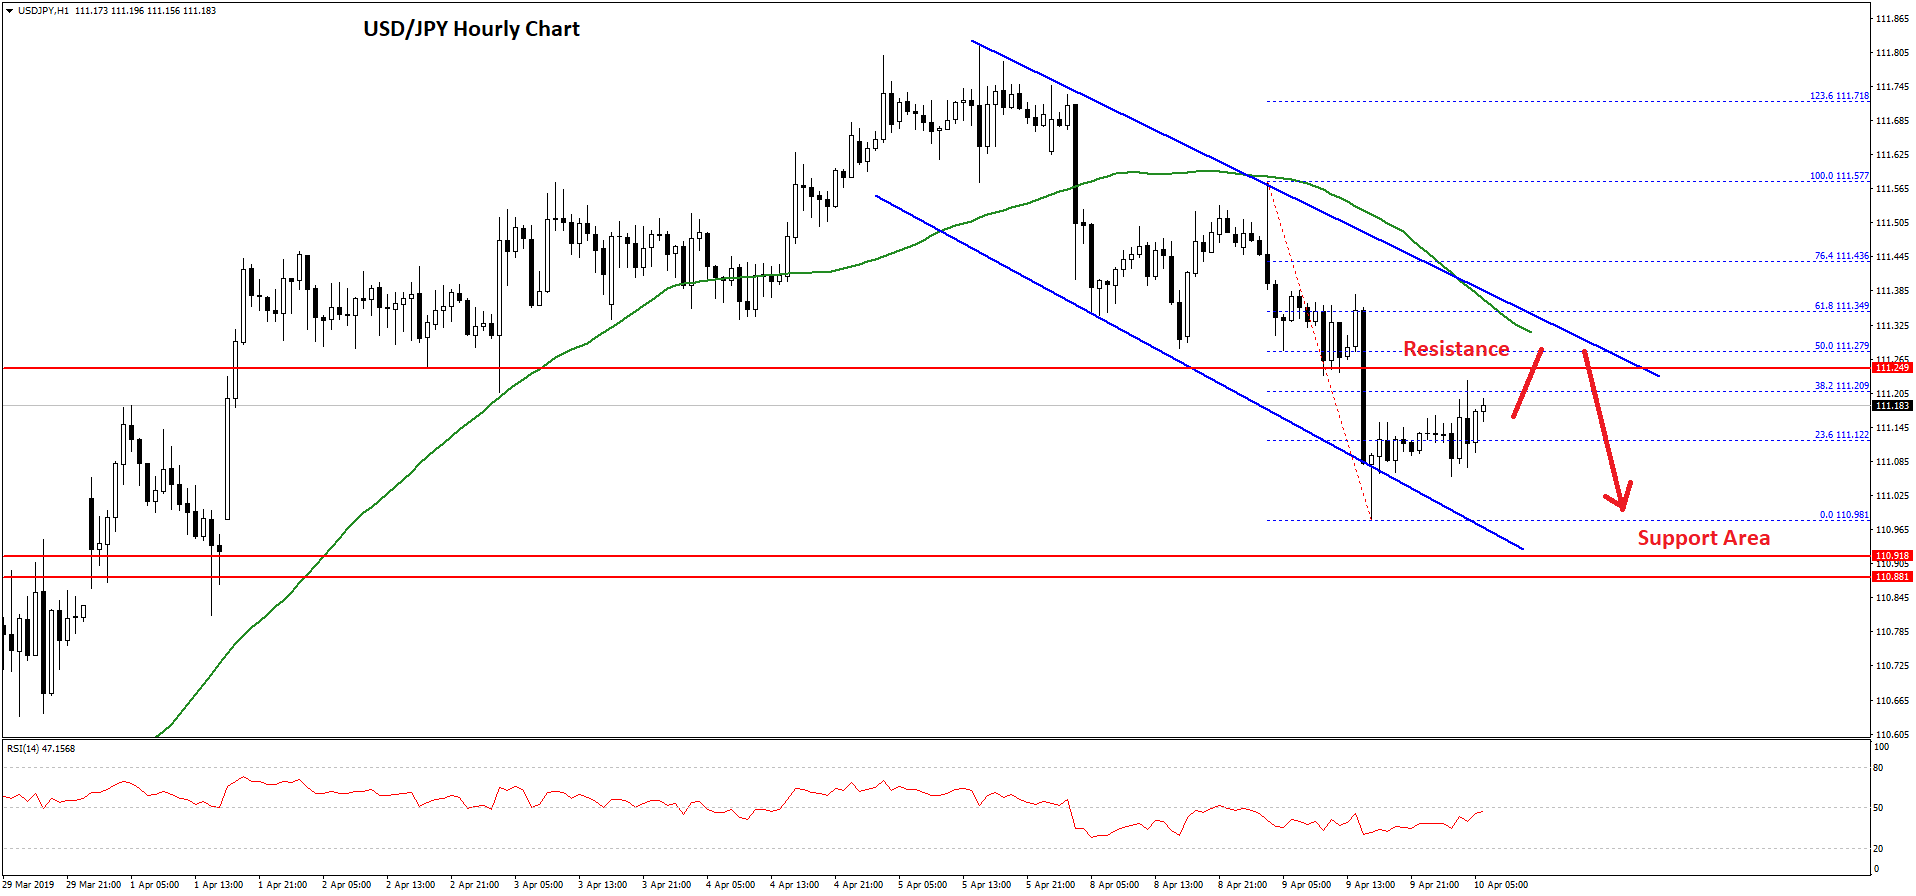
However, there is a strong resistance waiting on the upside near the 111.30 level. There is also a declining channel in place with resistance near the 111.30 on the hourly chart.
Besides, the 50% Fib retracement level of the last decline from the 111.57 high to 109.98 low is also near the 111.30 level. Therefore, USD/JPY sellers are likely to protect more gains above the 111.30 level.
If the pair fails to move above the 111.30 resistance, it is likely to resume its decline towards the 111.00 and 110.90 levels. The next key support is at 110.65.
On the other hand, a successful close above 111.30 and the 50 hourly SMA might push the pair into a positive zone towards the 111.50 and 111.60 levels.
Trade over 50 forex markets 24 hours a day with FXOpen. Take advantage of low commissions, deep liquidity, and spreads from 0.0 pips (additional fees may apply). Open your FXOpen account now or learn more about trading forex with FXOpen.
This article represents the opinion of the Companies operating under the FXOpen brand only. It is not to be construed as an offer, solicitation, or recommendation with respect to products and services provided by the Companies operating under the FXOpen brand, nor is it to be considered financial advice.
Stay ahead of the market!
Subscribe now to our mailing list and receive the latest market news and insights delivered directly to your inbox.


Latest articles

US Dollar Strengthens Amid Equity Market Weakness and Hawkish Fed Rhetoric
The US dollar continues to hold firm near multi-year highs as sentiment across equity markets deteriorates and investors increasingly expect the Federal Reserve to maintain a restrictive monetary policy stance for longer. The US economy remains resilient, while inflation risks

Bitcoin: Corrective Channel Broken as Traders Turn More Active
Bitcoin has come under the influence of several factors simultaneously. The wave of selling at the beginning of June was linked to Strategy's first disclosed Bitcoin sale in several years, a prolonged series of outflows from spot ETFs, and a

DAX 40: consolidation amid technology sell-off
A wave of selling in the technology sector that emerged earlier this week has weighed on European equities. The trigger was investor concern over the profitability of large-scale debt-funded investments by major US tech companies in AI infrastructure. The Nasdaq