


EUR/USD And USD/JPY Facing Key Hurdles
FXOpen

EUR/USD is currently correcting higher, but it is facing hurdles near the 1.1175 and 1.1180 levels. Similarly, USD/JPY is moving towards a major breakout resistance at 108.50.
Important Takeaways for EUR/USD and USD/JPY
- The Euro is holding the 1.1135 and 1.1130 support levels, with corrective moves.
- There is a key bearish trend line forming with resistance near 1.1175 on the hourly chart of EUR/USD.
- USD/JPY is climbing higher from the 107.65 support and approaching hurdles.
- There is a major bearish trend line in place with resistance near 108.50 on the hourly chart.
EUR/USD Technical Analysis
Recently, the Euro extended its decline below the 1.1200 support area against the US Dollar. The EUR/USD pair broke the 1.1175 support level and tested the next support near 1.1135.
A low is formed near 1.1134 on FXOpen and the pair settled below the 50 hourly simple moving average. It is currently correcting higher and trading above the 1.1150 level.
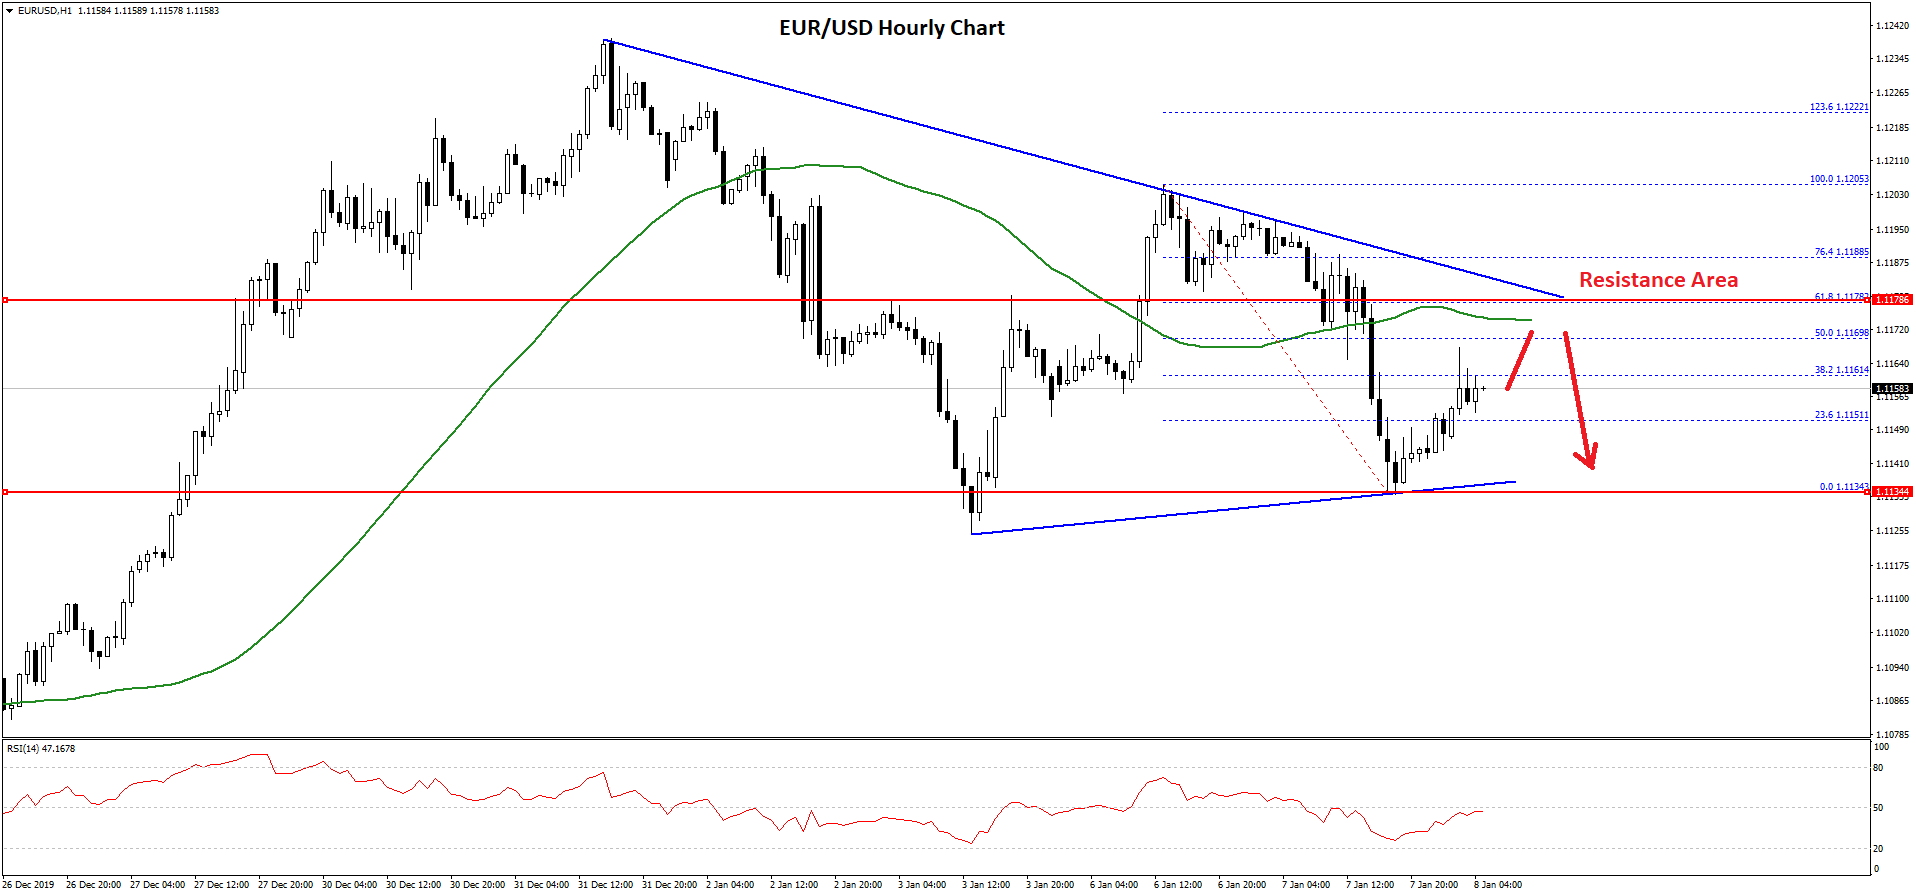
Besides, there was a break above the 23.6% Fib retracement level of the recent decline from the 1.1205 high to 1.1134 low. However, there are many hurdles on the upside near the 1.1175 level.
Moreover, there is a key bearish trend line forming with resistance near 1.1175 on the hourly chart of EUR/USD. The trend line is close to the 50% Fib retracement level of the recent decline from the 1.1205 high to 1.1134 low.
Therefore, a clear break above the 1.1175, the 50 hourly simple moving average, and 1.1180 resistance levels is must for more gains in the near term.
Conversely, the pair might struggle to move above the 1.1175 resistance area. In the mentioned case, it could decline back towards the 1.1135 support area.
If there is a downside break below the 1.1135 support, the pair may even struggle to stay above 1.1120. The next stop for the bears could be near the 1.1105 level, where the bulls could protect further losses.
USD/JPY Technical Analysis
The US Dollar dived recently below the 108.00 support area against the Japanese Yen. The USD/JPY pair traded close to the 107.65 support area before it starting an upside correction.
A low is formed near 107.64 and the pair is currently correcting higher. It climbed above the 108.00 resistance area. Besides, there was a break above the 50% Fib retracement level of the recent decline from the 108.62 high to 107.64 low.
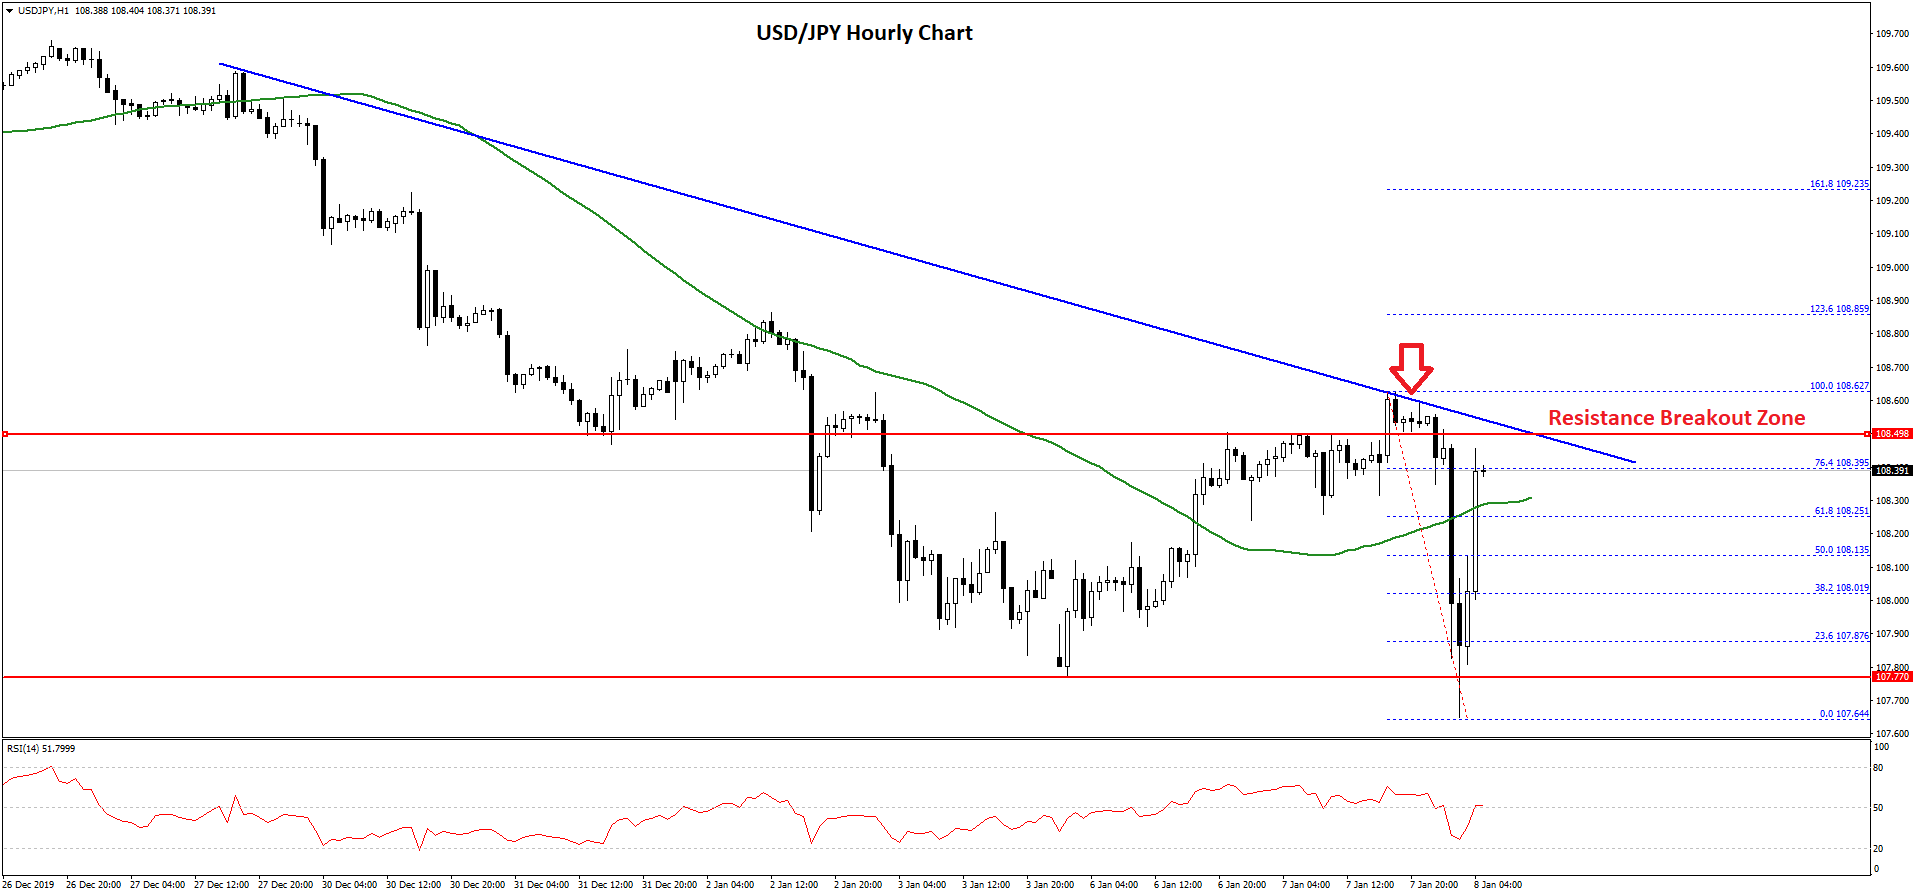
The pair is now trading above the 108.20 level and the 50 hourly simple moving average. However, it is facing a strong resistance near the 108.40 and 108.50 levels.
Besides, the 76.4% Fib retracement level of the recent decline from the 108.62 high to 107.64 low is likely to act as a hurdle. Moreover, there is a major bearish trend line in place with resistance near 108.50 on the hourly chart.
Therefore, a clear break above the 108.40 resistance and the trend line is must for an upside continuation. If the pair settles above 108.50, it could start a strong rise towards the 109.00 and 109.20 levels.
On the other hand, USD/JPY might fail to continue above the 108.50 resistance. In the mentioned case, it could resume its decline and trade below the 108.00 and 107.80 support levels in the near term.
Trade over 50 forex markets 24 hours a day with FXOpen. Take advantage of low commissions, deep liquidity, and spreads from 0.0 pips (additional fees may apply). Open your FXOpen account now or learn more about trading forex with FXOpen.
This article represents the opinion of the Companies operating under the FXOpen brand only. It is not to be construed as an offer, solicitation, or recommendation with respect to products and services provided by the Companies operating under the FXOpen brand, nor is it to be considered financial advice.
Stay ahead of the market!
Subscribe now to our mailing list and receive the latest market news and insights delivered directly to your inbox.


Latest articles

USD/JPY and USD/CHF Near Key Levels: The Dollar Supported by the Fed
The US dollar continues to trend upwards following the Federal Reserve meeting, drawing support from the regulator’s moderately hawkish stance and comments by Jerome Powell. Markets interpret the Fed’s rhetoric as a signal that restrictive policy is likely

EUR/USD and GBP/USD consolidate ahead of the Fed decision
European currencies are showing subdued dynamics, entering a consolidation phase following their previous advance. Earlier, EUR/USD and GBP/USD broke out of their ranges and strengthened; however, the subsequent correction has led both pairs to retest the previously breached

Meta: V-Shaped Recovery Meets Heavy Volume Resistance
The movement in Meta Platforms shares is being driven by two competing narratives. On one hand, advertising revenue is benefiting from AI-based tools: the Advantage+ platform continues to support strong advertiser demand, and the analyst consensus for Q1 2026 revenue