


FXOpen
EUR/USD struggled to settle above 1.1640 and is currently trading in a bearish zone. USD/CHF remains in an uptrend and it could extend gains above 0.9750.
Important Takeaways for EUR/USD and USD/CHF
- The Euro started a slow and steady decline from well above the 1.1640 level against the US Dollar.
- There is a major bearish trend line in place with resistance at 1.1625 on the hourly chart of EUR/USD.
- USD/CHF is trading in a positive zone above the 0.9720 support.
- There is a key bullish trend line formed with support at 0.9725 on the hourly chart.
EUR/USD Technical Analysis
The Euro started a decent upward move from the 1.1526 low against the US Dollar. The EUR/USD pair traded higher and broke the 1.1580 and 1.1600 resistance levels before sellers appeared near 1.1640.
The upside move was capped by the 1.1643 level and later the pair started a fresh downward move. It broke the 50% Fib retracement level of the last wave from 1.1526 low to 1.1643 high. There was even a spike below the 1.1580 support and the 50 hourly simple moving average.
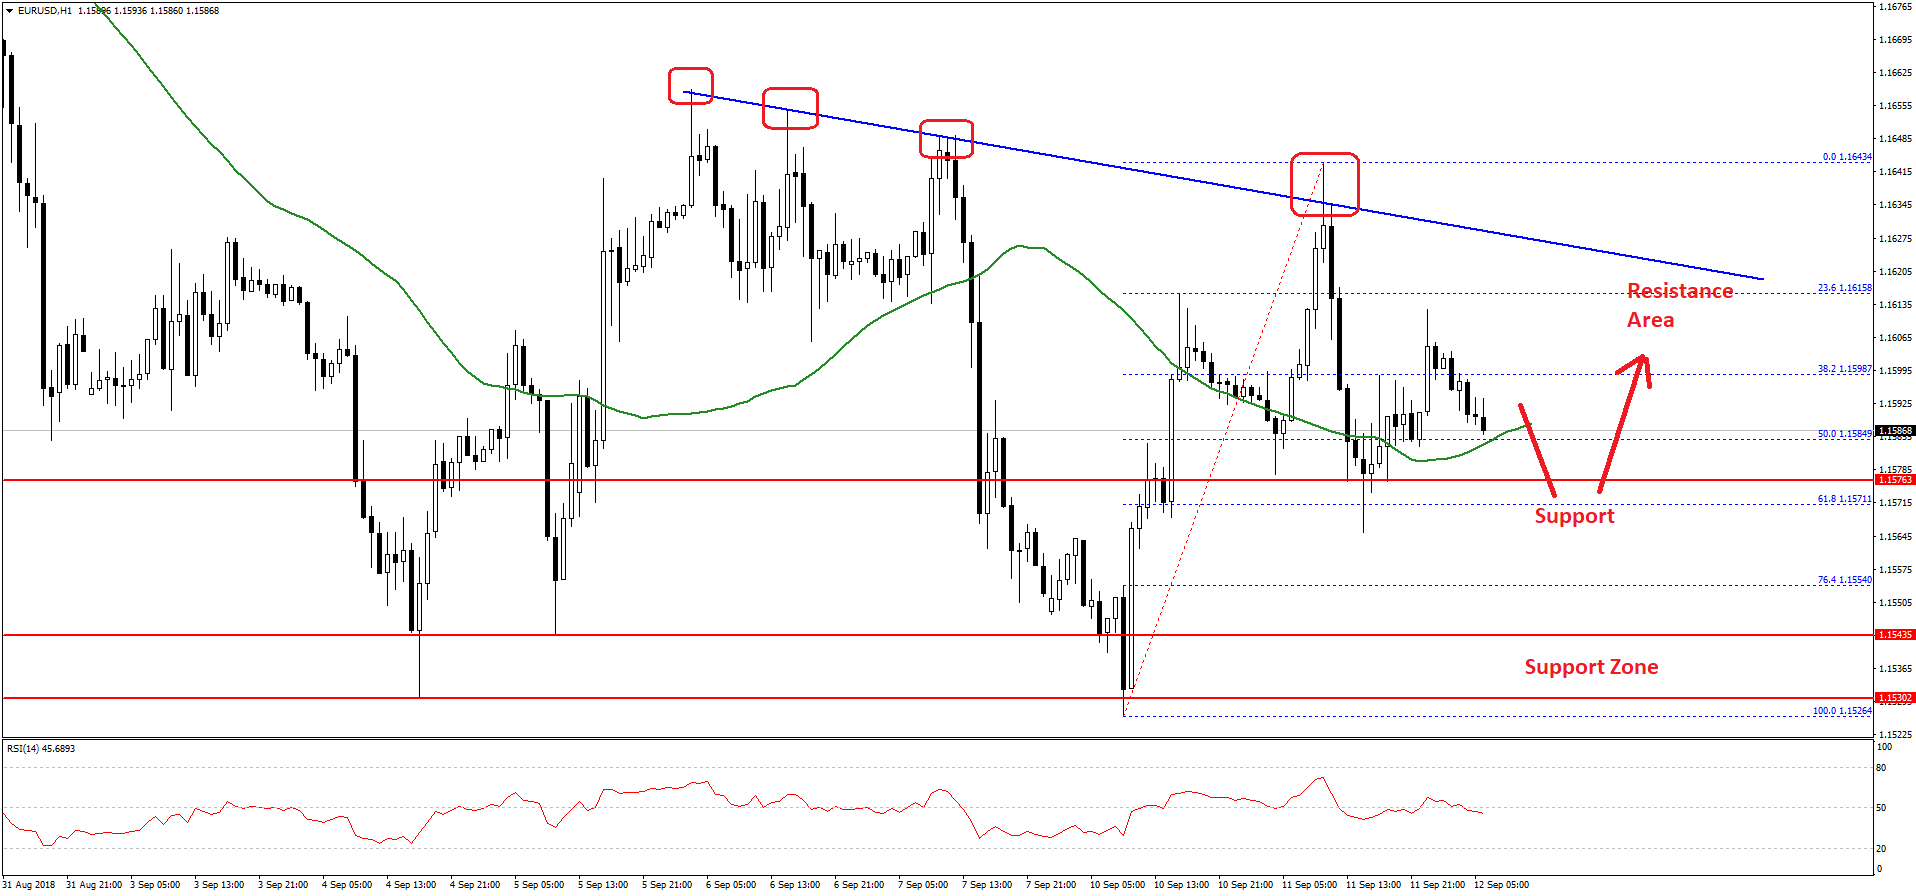
However, the pair found support near the 1.1565 level and the 61.8% Fib retracement level of the last wave from 1.1526 low to 1.1643 high. It is currently trading above the 1.1580 level and the 50 hourly SMA.
To the topside, there are many hurdles for buyers near the 1.1610 and 1.1620 levels. There is also a major bearish trend line in place with resistance at 1.1625 on the hourly chart.
Therefore, any major upsides from the current levels are likely to face sellers near 1.1610 and 1.1620 levels. Only a close above the trend line could trigger a move towards the 1.1640 and 1.1700 levels.
On the other hand, if the pair breaks the 50 hourly SMA again and trades below 1.1565, there could be an extended decline towards the 1.1554 level, which is the 76.4% Fib retracement level of the last wave.
USD/CHF Technical Analysis
The US Dollar started a solid upward move after forming a base near the 0.9640-50 zone against the Swiss franc. The USD/CHF pair gained bullish momentum and broke the 0.9680 and 0.9720 resistance levels.
The upside move was strong as the pair traded close to the 0.9770 swing high and settled above the 50 hourly simple moving average. It traded as high as 0.9758 and later started a downside correction.
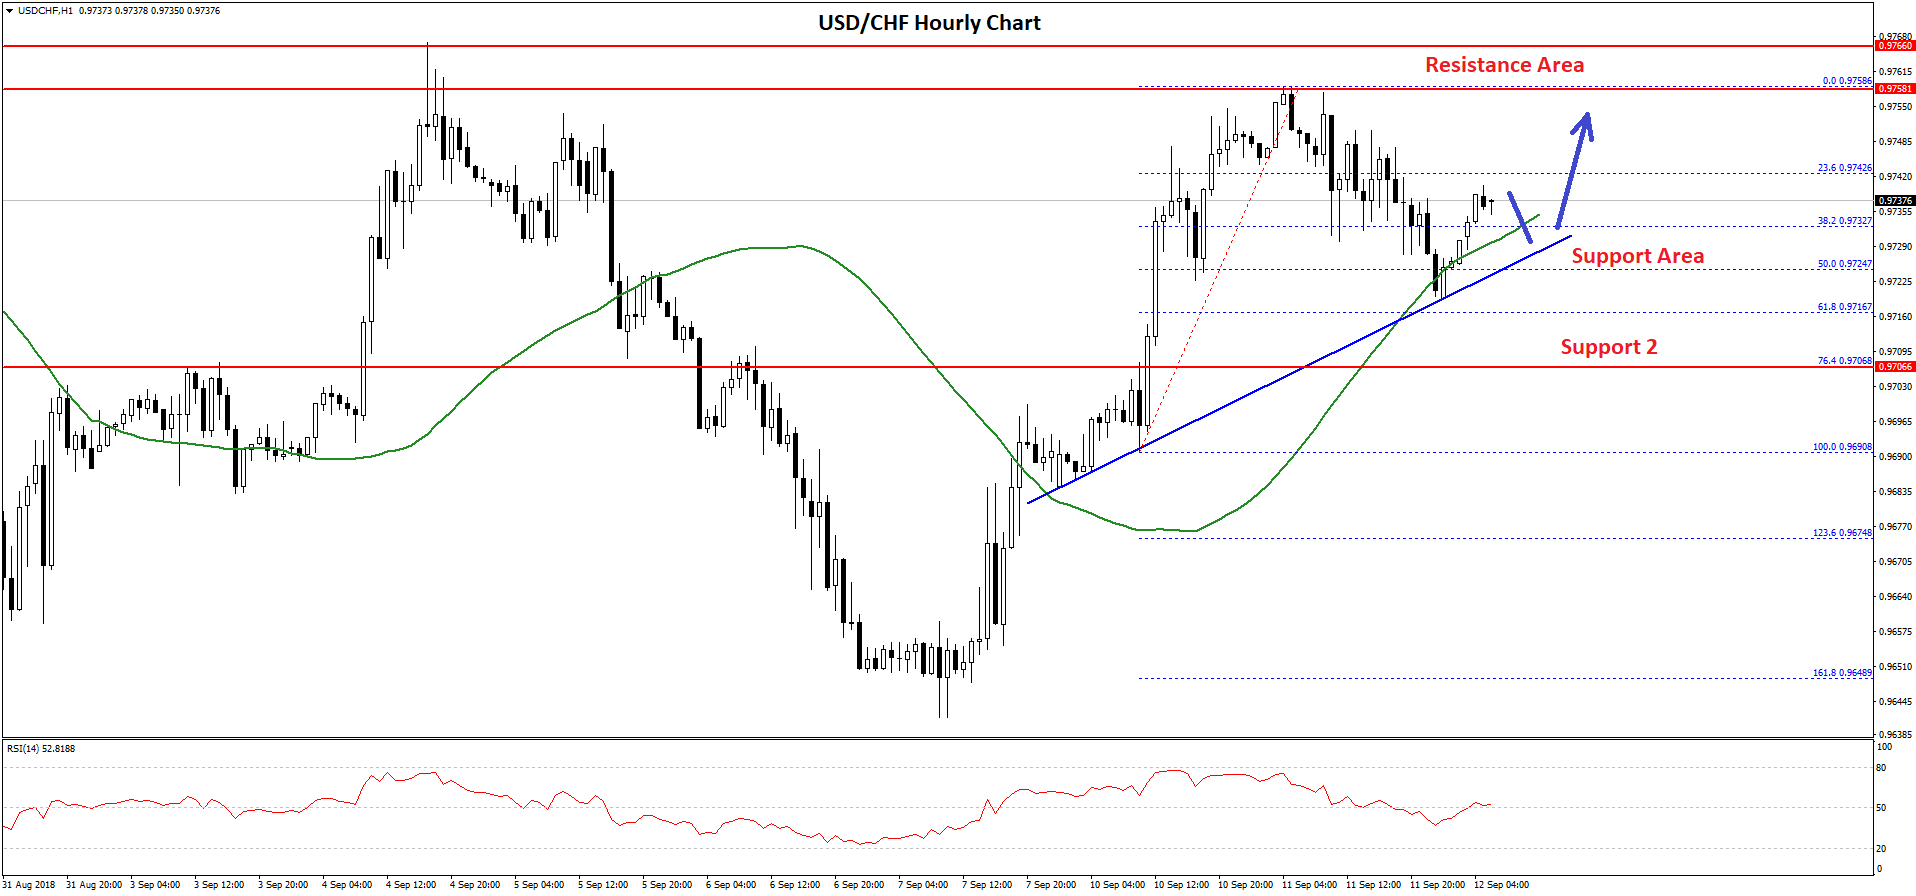
It declined and broke the 0.9750 support and the 38.2% Fib retracement level of the last wave from the 0.9690 low to 0.9758 high. However, the decline was protected by the 0.9720 support and the 50 hourly SMA.
Moreover, the 50% Fib retracement level of the last wave from the 0.9690 low to 0.9758 high also acted as a decent support for the greenback. More importantly, there is a key bullish trend line formed with support at 0.9725 on the hourly chart.
The pair is moving north and it could continue to move higher towards the 0.9760 and 0.9770 resistance levels. On the flip side, if there is a downside move, the trend line support and 0.9720 are likely to act as solid buy zones in the near term.
Should there be a close below the 0.9720 support, the pair could correct towards the 0.9700 and 0.9690 levels.
Trade over 50 forex markets 24 hours a day with FXOpen. Take advantage of low commissions, deep liquidity, and spreads from 0.0 pips. Open your FXOpen account now or learn more about trading forex with FXOpen.
This article represents the opinion of the Companies operating under the FXOpen brand only. It is not to be construed as an offer, solicitation, or recommendation with respect to products and services provided by the Companies operating under the FXOpen brand, nor is it to be considered financial advice.
Stay ahead of the market!
Subscribe now to our mailing list and receive the latest market news and insights delivered directly to your inbox.

Latest from Forex Analysis
Latest articles

Weekly Market Wrap With Gary Thomson: Nasdaq, EUR/USD, USD/CHF, Brent Crude Oil, Googl Shares
Get the latest scoop on the week's hottest headlines, all in one convenient video. Join Gary Thomson, the COO of FXOpen UK, as he breaks down the most significant news reports and shares his expert insights.
- Nasdaq Composite: Worst Session

Analysis of AUD/USD: Exchange Rate Falls to Early May Low
As indicated by the 4-hour AUD/USD chart today:
→ the rate fell below 0.652, a level last seen on May 2;
→ the RSI indicator dropped below 15, a level last seen during the panic over the spread of COVID-19

Analysis of AMZN Stock: Price at 1.5-Month Low
As shown in the AMZN chart, the stock price dropped below:
→ the psychological level of $180;
→ the mid-June interim low.
The last time AMZN traded below $180 was in early June.
Thus, AMZN has faced sell-offs, similar to other tech