


EUR/USD Consolidating While USD/CHF Is Correcting Gains
FXOpen
EUR/USD declined heavily and broke the key 1.1160 and 1.1140 support levels. USD/CHF traded towards the 0.9820 level and it is currently correcting gains.
Important Takeaways for EUR/USD and USD/CHF
- The Euro declined heavily and traded towards the 1.1060 level against the US Dollar.
- There is a key connecting bearish trend line forming with resistance near 1.1110 on the hourly chart of EUR/USD.
- USD/CHF climbed higher nicely above 0.9750 and traded close to the 0.9820 level.
- Recently, there was a break below a major bullish trend line with support near 0.9790 on the hourly chart.
EUR/USD Technical Analysis
In the past few days, the Euro declined heavily below the 1.1180 and 1.1160 support levels against the US Dollar. The EUR/USD pair even broke the 1.1140 support to enter a bearish zone.
Finally, there was a break below the 1.1080 level and the 50 hourly simple moving average. The pair traded as low as 1.1065 on FXOpen and recently started an upside correction.
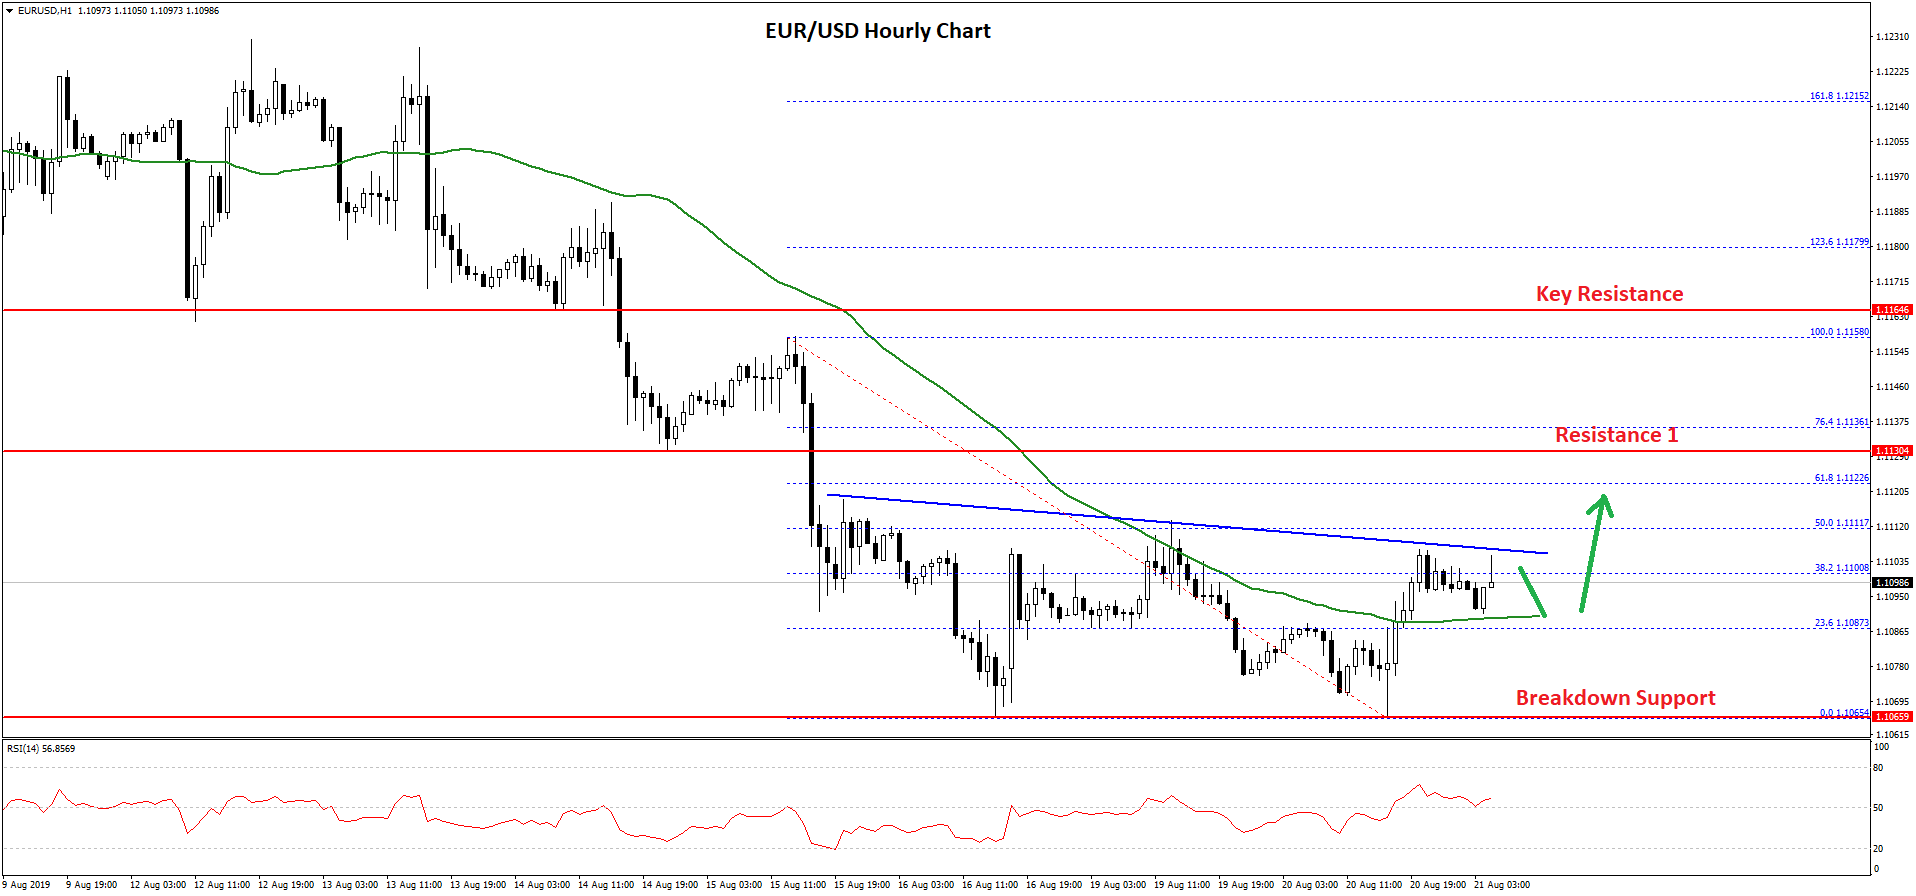
There was a break above the 1.1085 level and a close above the 50 hourly simple moving average. Moreover, the pair climbed above the 38.2% Fib retracement level of the recent decline from the 1.1158 high to 1.1065 low.
However, the pair is struggling to gain strength above 1.1100 and 1.1120. There is also a key connecting bearish trend line forming with resistance near 1.1110 on the hourly chart of EUR/USD.
The 50% Fib retracement level of the recent decline from the 1.1158 high to 1.1065 low is also near the 1.1110 level to act as a strong resistance. If there is an upside break above 1.1110, the pair could correct further higher towards the 1.1130 level.
The mentioned 1.1130 level is a major hurdle, above which the pair could climb towards the 1.1160 level.
On the downside, an initial support is near the 1.1085 level and the 50 hourly SMA. If there is a downside break below the 50 hourly SMA, the pair could revisit the 1.1065 swing low. Any further decline may perhaps call for a test of the 1.1040 level.
USD/CHF Technical Analysis
The US Dollar started a decent upward move from the 0.9660 support area against the Swiss franc. The USD/CHF pair broke the 0.9700 and 0.9750 resistance levels to move into a bullish zone.
Finally, the pair climbed above the 0.9800 level and the 50 hourly simple moving average. However, the bulls struggled to clear the key 0.9820 resistance level. As a result, the pair started a downside correction and traded below the 0.9800 level.
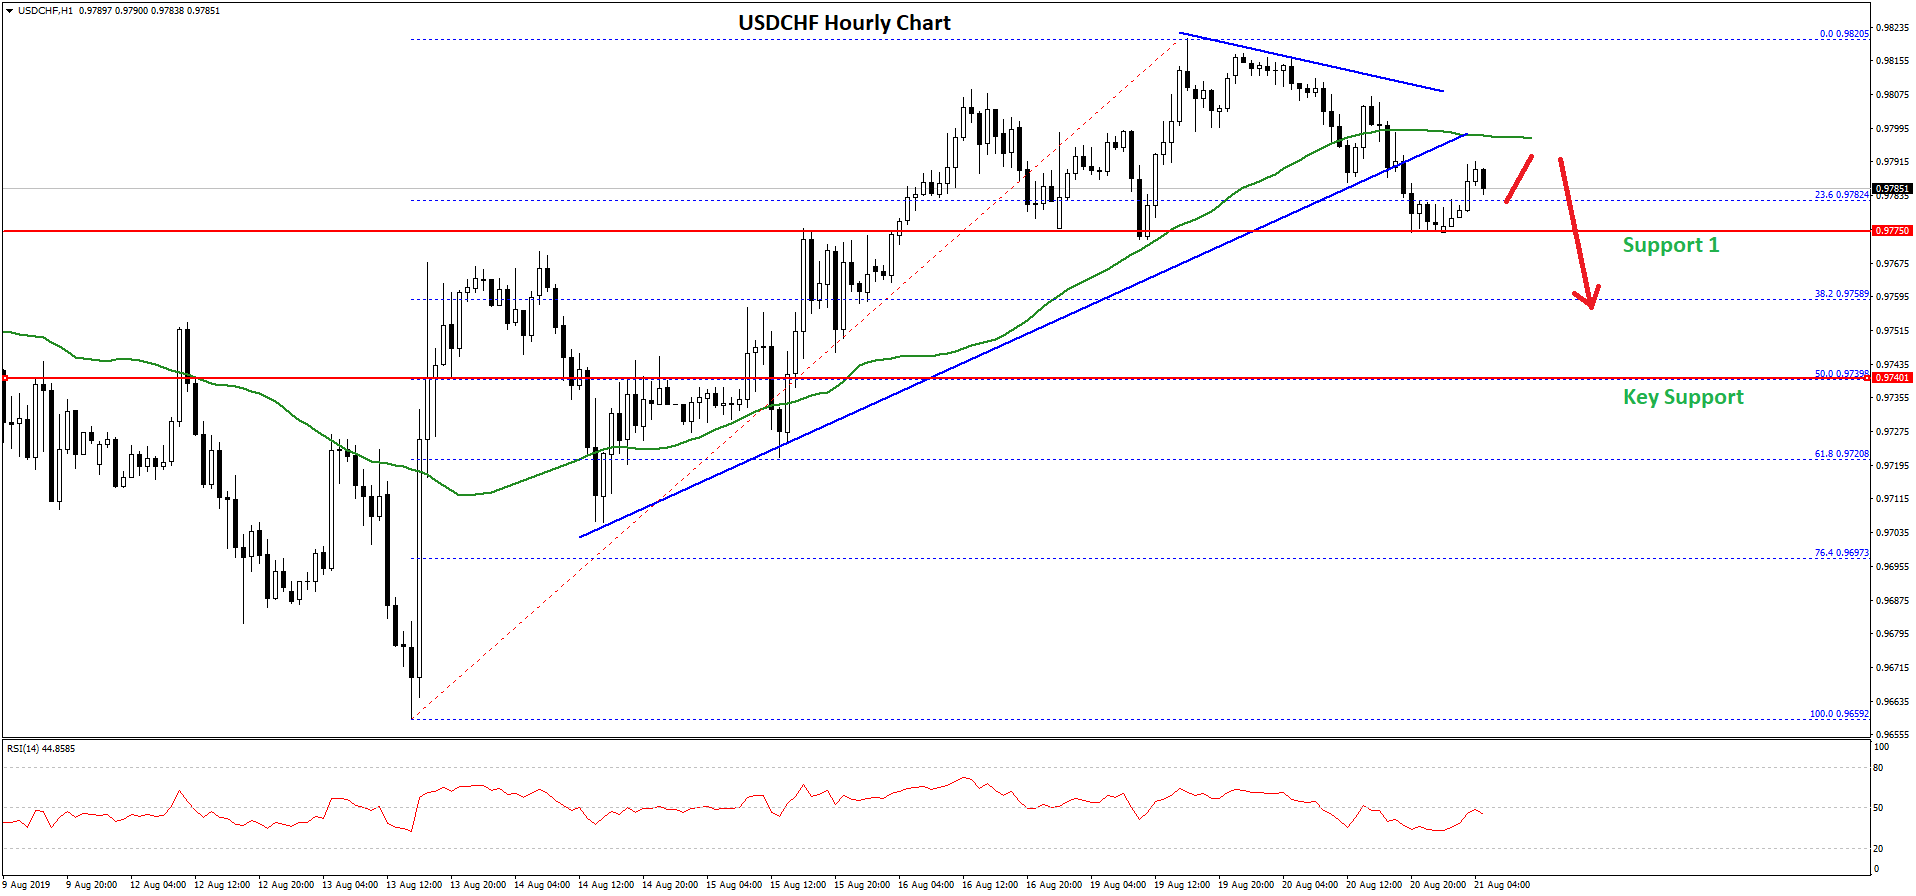
Moreover, there was a break below a major bullish trend line with support near 0.9790 on the hourly chart. The pair traded below the 23.6% Fib retracement level of the upward move from the 0.9659 low to 0.9820 high.
However, the 0.9780 level is acting as a support. If there is a downside break below the 0.9780 and 0.9775 supports, the pair could extend its decline.
The next major support is near the 0.9740 level. It represents the 50% Fib retracement level of the upward move from the 0.9659 low to 0.9820 high.
Conversely, if there is no downside break below 0.9775, the pair could resume its rise. An immediate resistance is near the 0.9800 level, above which USD/CHF make another attempt to climb above the 0.9820 resistance level.
Trade over 50 forex markets 24 hours a day with FXOpen. Take advantage of low commissions, deep liquidity, and spreads from 0.0 pips (additional fees may apply). Open your FXOpen account now or learn more about trading forex with FXOpen.
This article represents the opinion of the Companies operating under the FXOpen brand only. It is not to be construed as an offer, solicitation, or recommendation with respect to products and services provided by the Companies operating under the FXOpen brand, nor is it to be considered financial advice.
Stay ahead of the market!
Subscribe now to our mailing list and receive the latest market news and insights delivered directly to your inbox.


Latest articles

Apple: Earnings Day Above the Activity Zone
On 30 April, after the market close, Apple Inc. will release its financial results for the second quarter of fiscal 2026. The consensus forecast, based on estimates from 31 analysts, points to revenue of around $109.7 billion, with expected

USD/JPY and USD/CHF Near Key Levels: The Dollar Supported by the Fed
The US dollar continues to trend upwards following the Federal Reserve meeting, drawing support from the regulator’s moderately hawkish stance and comments by Jerome Powell. Markets interpret the Fed’s rhetoric as a signal that restrictive policy is likely

EUR/USD and GBP/USD consolidate ahead of the Fed decision
European currencies are showing subdued dynamics, entering a consolidation phase following their previous advance. Earlier, EUR/USD and GBP/USD broke out of their ranges and strengthened; however, the subsequent correction has led both pairs to retest the previously breached