


EUR/USD Could Climb Higher While USD/CHF Might Decline
FXOpen

EUR/USD is showing positive signs above the 1.1080 level and it could rise steadily. USD/CHF is currently correcting lower and it might start a major downside correction.
Important Takeaways for EUR/USD and USD/CHF
- The Euro is currently trading nicely above the 1.1065 and 1.1090 support levels against the US Dollar.
- There is a key bearish trend line forming with resistance near 1.1120 on the hourly chart of EUR/USD.
- USD/CHF started a downside correction after setting a new weekly high near the 0.9968 level.
- There was a break below a major bullish trend line with support near 0.9945 on the hourly chart.
EUR/USD Technical Analysis
After a fresh decline, the Euro found support just above the 1.1070 level against the US Dollar. The EUR/USD pair formed a support base near 1.1075 and recently started a decent upward move.
A swing low was formed near 1.1073 on FXOpen and the pair corrected above the 50 hourly simple moving average. Moreover, there was a break above the 1.1080 and 1.1100 resistance levels.
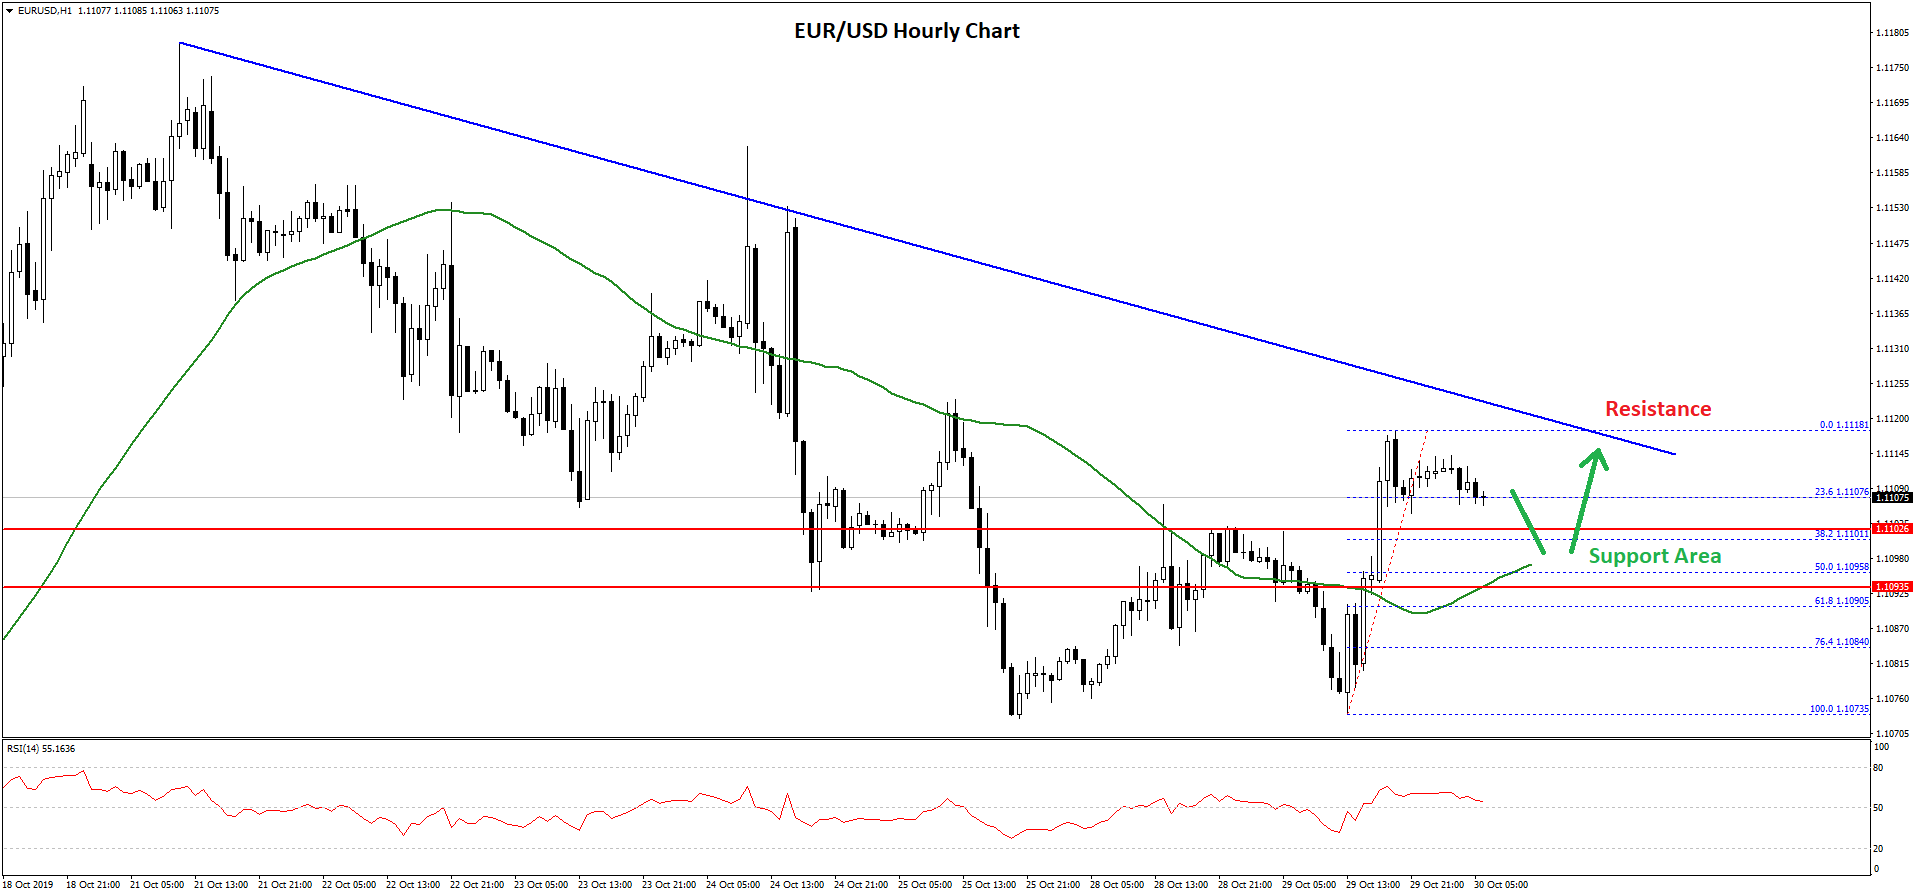
The pair traded as high as 1.1118 and the pair is currently consolidating gains. An immediate support is near the 1.1105 level, plus the 23.6% Fib retracement level of the recent wave from the 1.1073 low to 1.1118 high.
On the downside, there is a strong support forming near the 1.1090 level. Moreover, the 50% Fib retracement level of the recent wave from the 1.1073 low to 1.1118 high is likely to provide support.
If there is a downside break below the 1.1090 level, the pair could decline back towards the 1.1075 support area. Any further losses could lead EUR/USD towards the 1.1050 level.
On the upside, there is a strong resistance forming near the 1.1120 level. In addition, there is a key bearish trend line forming with resistance near 1.1120 on the hourly chart of EUR/USD.
Therefore, an upside break above the 1.1120 level is needed for more gains in the near term. The next key resistances are near the 1.1145 and 1.1160 levels.
USD/CHF Technical Analysis
The US Dollar followed a strong uptrend this month and settled above the 0.9900 level against the Swiss franc. The USD/CHF pair even climbed towards the 1.0000 resistance recently and traded as high as 0.9968.
At the moment, the pair is correcting lower and is trading below the 0.9950 level. There was a break below a major bullish trend line with support near 0.9945 on the hourly chart.
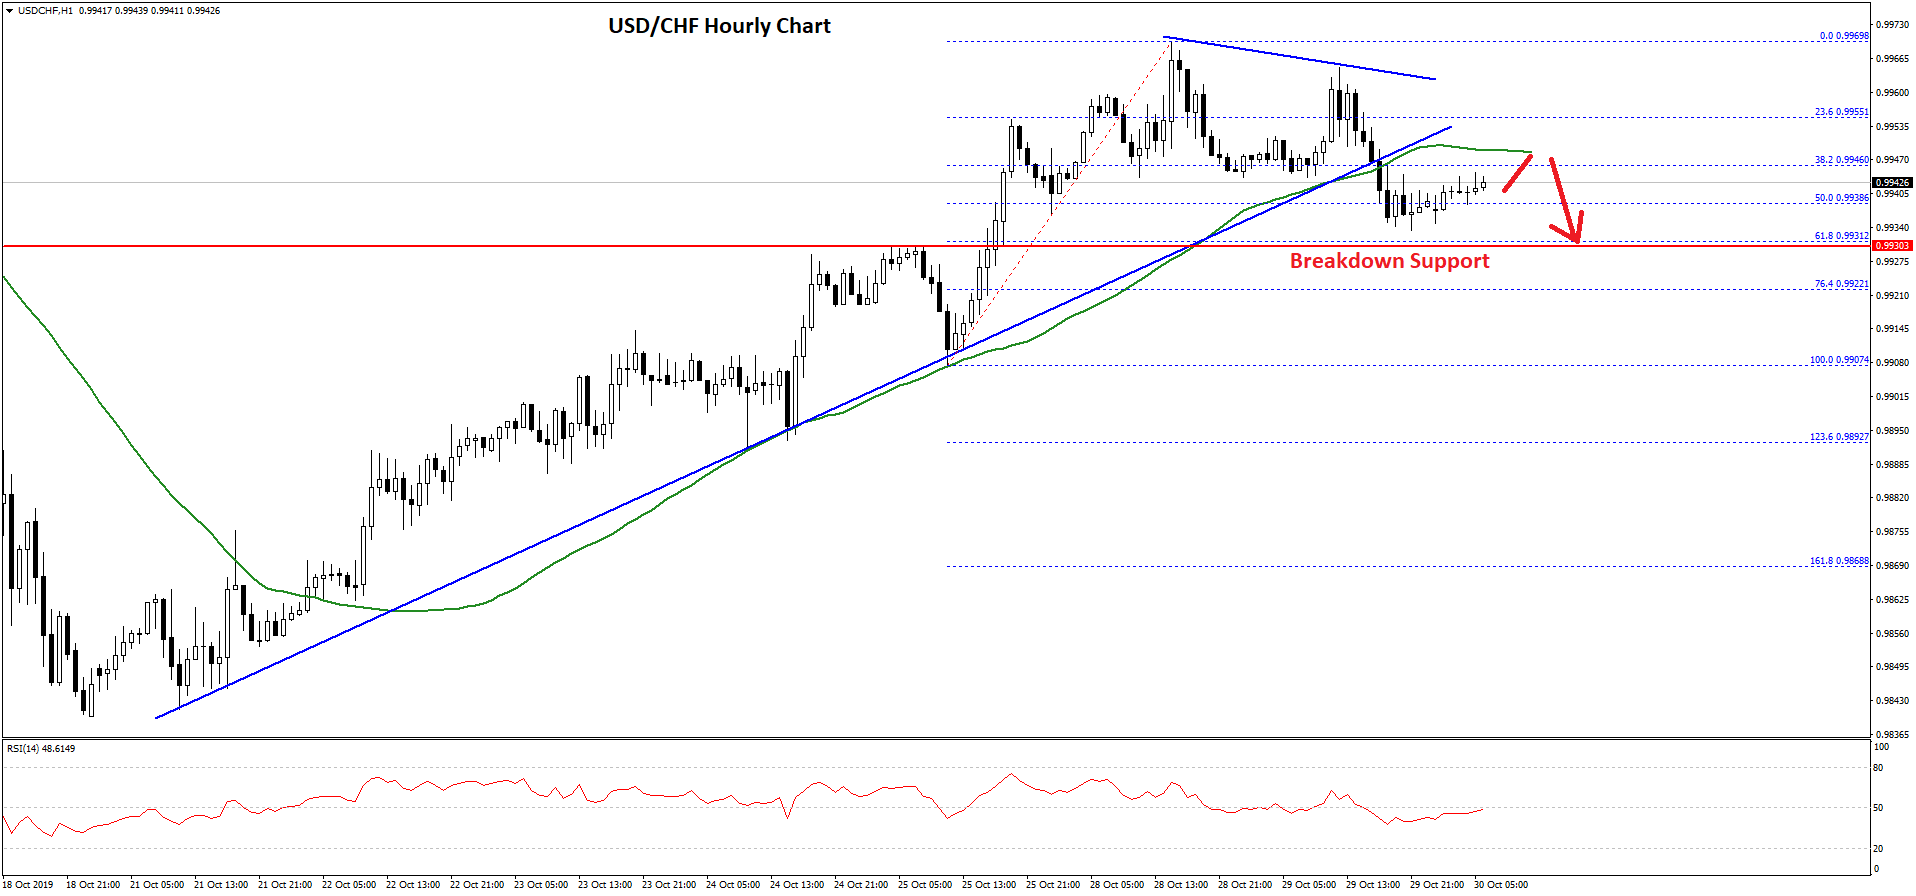
The pair even traded below the 50% Fib retracement level of the upward move from the 0.9907 low to 0.9968 high. Moreover, there was a close below 0.9945 and the 50 hourly simple moving average.
On the downside, there is a breakdown support near the 0.9930 level. It also coincides with the 61.8% Fib retracement level of the upward move from the 0.9907 low to 0.9968 high.
Therefore, a clear break below the 0.9930 support area might set the pace for more downsides. The next key supports are near the 0.9910 and 0.9900 levels.
On the upside, the previous support near 0.9950 and the 50 hourly simple moving average might act as a hurdle. A clear break above 0.9950 could push USD/CHF towards 0.9975 or even 0.9990 in the near term.
Trade over 50 forex markets 24 hours a day with FXOpen. Take advantage of low commissions, deep liquidity, and spreads from 0.0 pips (additional fees may apply). Open your FXOpen account now or learn more about trading forex with FXOpen.
This article represents the opinion of the Companies operating under the FXOpen brand only. It is not to be construed as an offer, solicitation, or recommendation with respect to products and services provided by the Companies operating under the FXOpen brand, nor is it to be considered financial advice.
Stay ahead of the market!
Subscribe now to our mailing list and receive the latest market news and insights delivered directly to your inbox.


Latest articles

US Dollar Strengthens Amid Equity Market Weakness and Hawkish Fed Rhetoric
The US dollar continues to hold firm near multi-year highs as sentiment across equity markets deteriorates and investors increasingly expect the Federal Reserve to maintain a restrictive monetary policy stance for longer. The US economy remains resilient, while inflation risks

Bitcoin: Corrective Channel Broken as Traders Turn More Active
Bitcoin has come under the influence of several factors simultaneously. The wave of selling at the beginning of June was linked to Strategy's first disclosed Bitcoin sale in several years, a prolonged series of outflows from spot ETFs, and a

DAX 40: consolidation amid technology sell-off
A wave of selling in the technology sector that emerged earlier this week has weighed on European equities. The trigger was investor concern over the profitability of large-scale debt-funded investments by major US tech companies in AI infrastructure. The Nasdaq