


EUR/USD Could Decline While USD/JPY Is Climbing
FXOpen

EUR/USD is struggling to gain momentum above the 1.1220 and 1.1240 resistance levels. USD/JPY climbed higher recently and it remains supported on dips above 106.00.
Important Takeaways for EUR/USD and USD/JPY
- The Euro tested the key 1.1250 resistance area recently and it is currently trading in a range.
- There is a key bearish trend line forming with resistance near 1.1225 on the hourly chart of EUR/USD.
- USD/JPY broke a major bearish trend line near 105.65 on the hourly chart to start a decent upward move.
- The pair is currently correcting lower, but dips remain supported above 106.00.
EUR/USD Technical Analysis
The Euro formed a decent support base near the 1.1080 level against the US Dollar. The EUR/USD pair started a solid upward move and climbed above the 1.1180 and 1.1200 resistance levels.
Moreover, there was a break above the 1.1220 level and the 50 hourly simple moving average. Finally, the pair traded close to the 1.1250 resistance on FXOpen, where sellers took a stand.
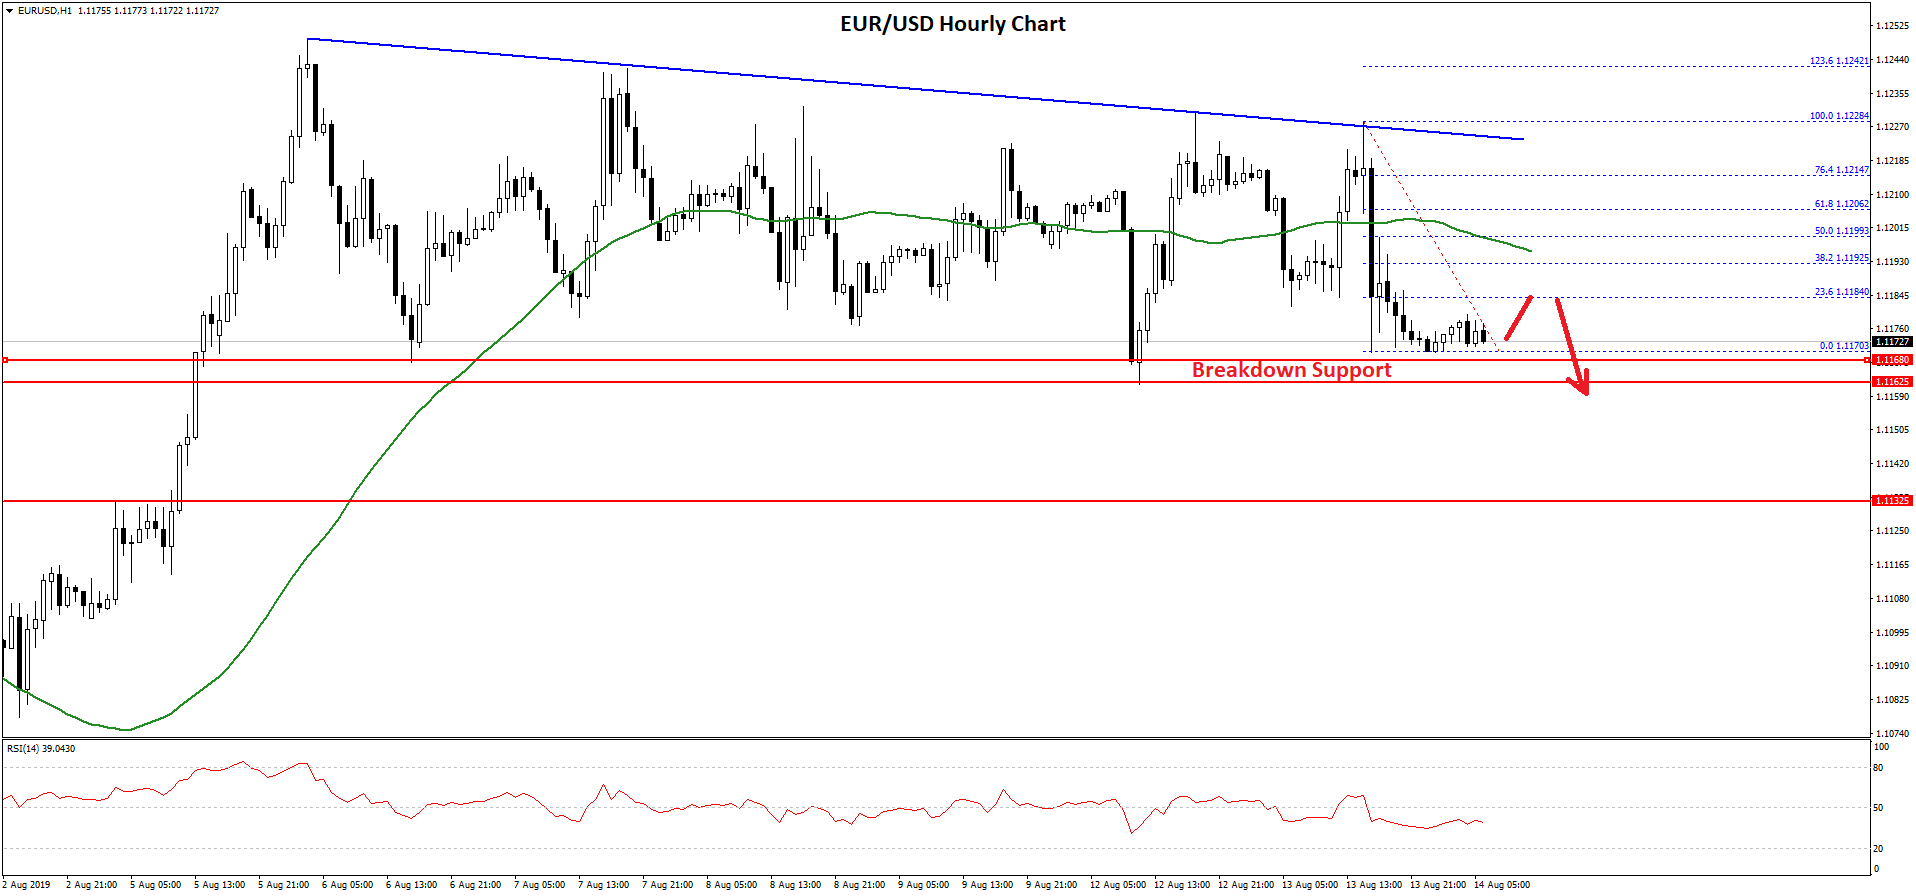
The pair corrected lower and declined below the 1.1200 support area. However, the 1.1160 area acted as strong support. The last swing low was formed near 1.1170 and the pair is now trading well below the 50 hourly simple moving average.
On the upside, an immediate resistance is near the 1.1185 level plus the 23.6% Fib retracement level of the recent decline from the 1.1228 high to 1.1170 low.
The main resistance on the upside is near the 1.1200 and 1.1220 levels. Moreover, there is a key bearish trend line forming with resistance near 1.1225 on the hourly chart of EUR/USD.
Besides, the 50% Fib retracement level of the recent decline from the 1.1228 high to 1.1170 low is also near the 1.1200 level and the 50 hourly simple moving average to act as a strong resistance.
Therefore, the pair remains at a risk of a downside break below the 1.1160 support if the bulls continue to face hurdles near 1.1200. On the downside, the next key support below 1.1160 is near the 1.11220 level.
USD/JPY Technical Analysis
Earlier this week, the US Dollar followed a bearish path below the 106.00 level against the Japanese Yen. The USD/JPY pair traded as low as 105.07 before it started a strong upward move.
The pair broke the 105.50 and 105.80 resistance levels to move into a positive zone. Moreover, the pair broke a major bearish trend line near 105.65 on the hourly chart.
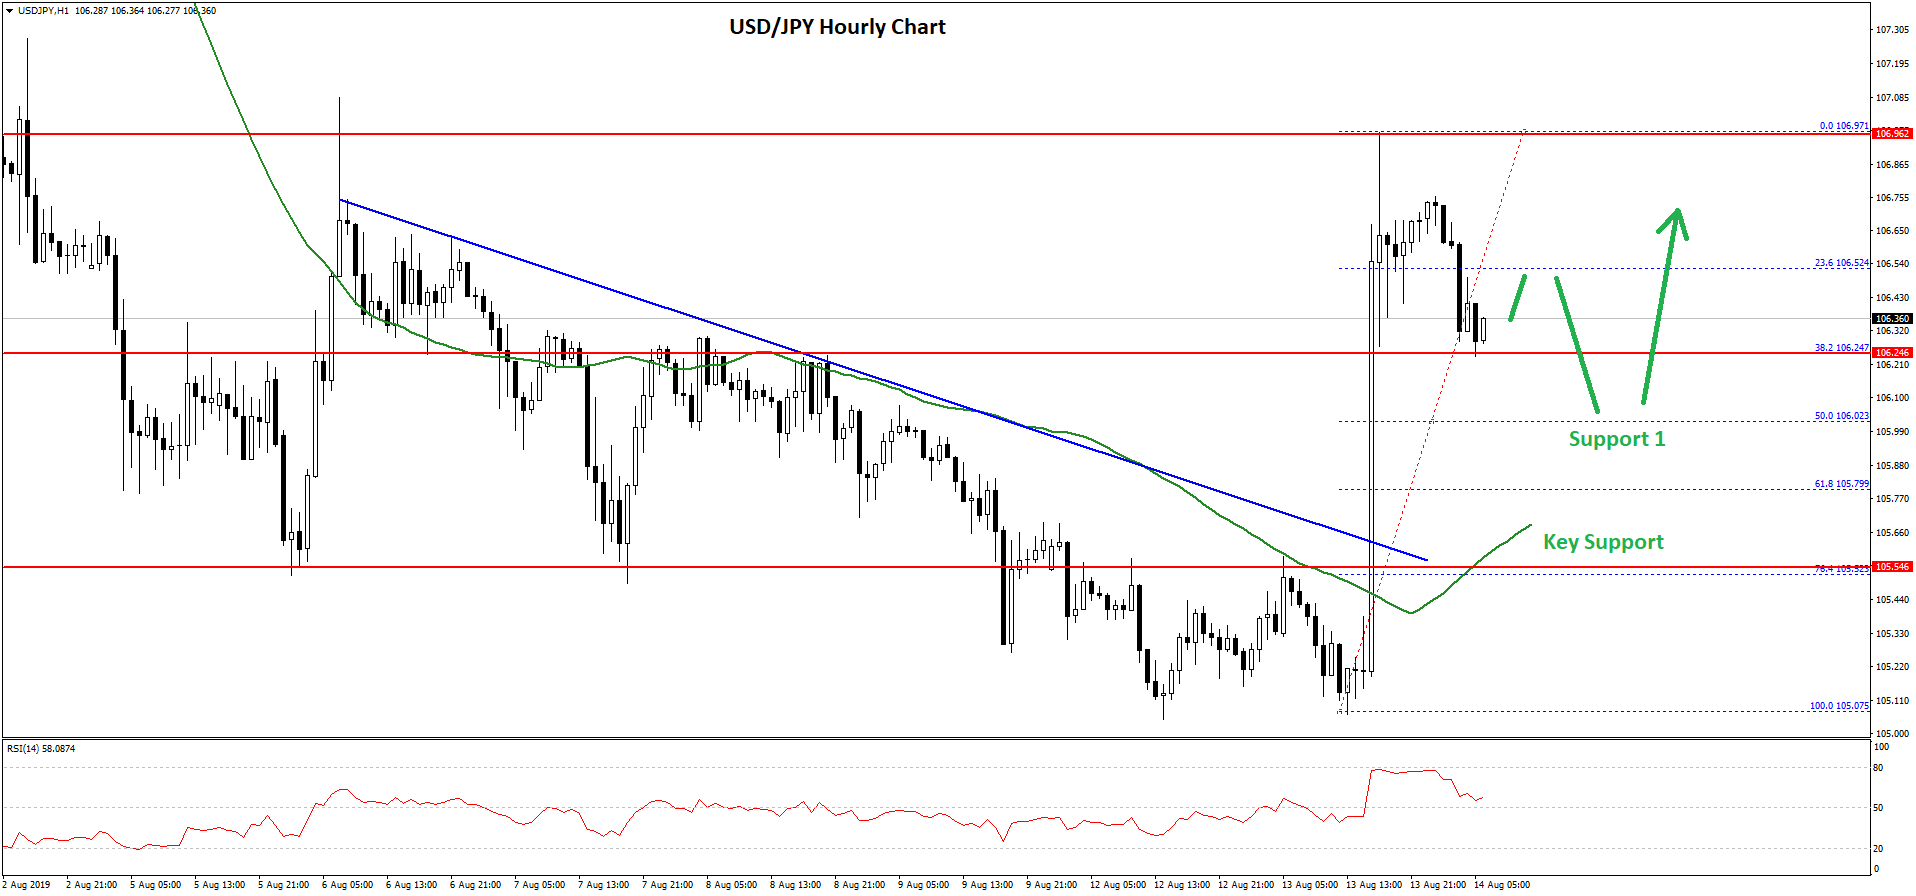
Finally, there was a close above 106.00 and the 50 hourly simple moving average. The pair climbed above the 106.50 level and a swing high was formed near 106.97 before the pair started a downside correction.
It traded below the 106.50 level plus the 23.6% Fib retracement level of the last wave from the 105.07 low to 106.97 high. At the moment, the pair is trading near the 106.25 support area.
The next key support on the downside is near the 106.00 area plus the 50% Fib retracement level of the last wave from the 105.07 low to 106.97 high.
However, the main support is near the 105.60, below which the pair could move back in a bearish zone. On the upside, the pair is facing a couple of key resistances near 106.75 and 106.80, above which the pair might continue to rise towards 107.00 and 107.20.
Trade over 50 forex markets 24 hours a day with FXOpen. Take advantage of low commissions, deep liquidity, and spreads from 0.0 pips (additional fees may apply). Open your FXOpen account now or learn more about trading forex with FXOpen.
This article represents the opinion of the Companies operating under the FXOpen brand only. It is not to be construed as an offer, solicitation, or recommendation with respect to products and services provided by the Companies operating under the FXOpen brand, nor is it to be considered financial advice.
Stay ahead of the market!
Subscribe now to our mailing list and receive the latest market news and insights delivered directly to your inbox.


Latest articles

DAX 40: consolidation amid technology sell-off
A wave of selling in the technology sector that emerged earlier this week has weighed on European equities. The trigger was investor concern over the profitability of large-scale debt-funded investments by major US tech companies in AI infrastructure. The Nasdaq

Euro Hits Fresh Yearly Lows Amid Dovish ECB Signals
The euro remains under pressure following weak macroeconomic data from the euro area and fresh signals that the European Central Bank is prepared to maintain a more accommodative monetary policy stance. Data released yesterday pointed to a deterioration in business

Pound at Key Levels: Markets Assess Impact of Political Uncertainty in the UK
The British pound remains under pressure following increased political uncertainty in the United Kingdom triggered by the Prime Minister’s resignation. Investors are assessing potential shifts in the political and economic policy outlook after the head of government stepped down,