


FXOpen

EUR/USD is struggling to break the 1.1000 resistance area and remains at a risk of a bearish reaction. Conversely, USD/JPY might start a decent rise if it breaks 107.25 and 107.45.
Important Takeaways for EUR/USD and USD/JPY
- The Euro is currently facing a strong resistance near the 1.1000 level.
- There was a break below a connecting bullish trend line with support near 1.0974 on the hourly chart of EUR/USD.
- USD/JPY is slowly climbing and it is now trading above the 107.00 pivot level.
- There is a major bearish trend line forming with resistance near 107.25 on the hourly chart.
EUR/USD Technical Analysis
The Euro started an upside correction from the 1.0885 swing low against the US Dollar. The EUR/USD pair broke the 1.0920 and 1.0950 resistance levels to move into a short term positive zone.
The pair even climbed above 1.0980 and the 50 hourly simple moving average. However, the pair faced a strong resistance area near the 1.1000 level. A high was formed near 1.1005 on FXOpen and recently the pair started a downward move.
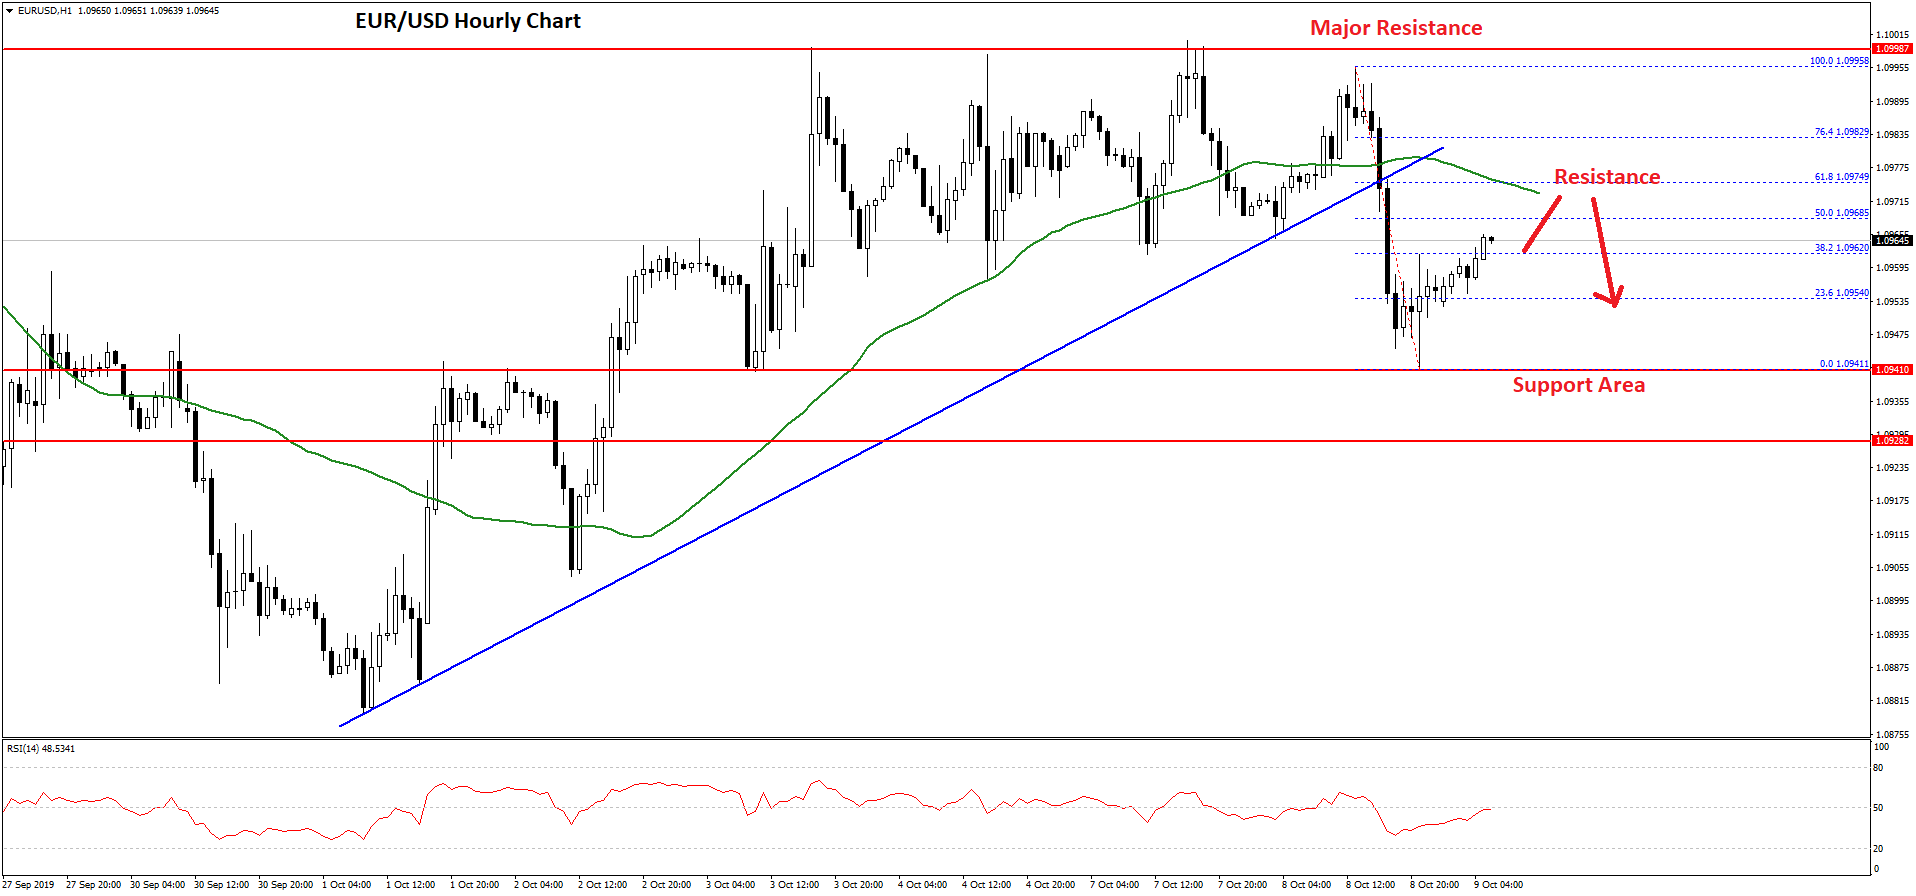
It broke the 1.0980 support area and the 50 hourly simple moving average. There was a break below a connecting bullish trend line with support near 1.0974 on the hourly chart of EUR/USD.
Moreover, it broke 1.0950 and traded as low as 1.0941. The pair is currently correcting higher and is trading above the 1.0950 level. An immediate resistance is near the 1.0968 and the 50% Fib retracement level of the recent decline from the 1.0995 high to 1.0941 low.
However, the main resistance is near the 1.0975 and the 50 hourly SMA. It also coincides with the 61.8% Fib retracement level of the recent decline from the 1.0995 high to 1.0941 low.
Therefore, the pair is likely to face a strong resistance near the 1.0975 level. Overall, the pair needs to surpass the 1.0975 and 1.1000 resistances to continue higher. The next key resistance is near the 1.1050 level.
If the pair fails to climb above 1.1000, there is a risk of a fresh decline below the 1.0940 and 1.0920 support levels in the near term.
USD/JPY Technical Analysis
The US Dollar started a decent recovery from the 106.48 low against the Japanese Yen. The USD/JPY pair traded above the 106.80 and 107.00 resistance levels to start an upside correction.
Moreover, there was a close above the 107.00 level and the 50 hourly simple moving average. The pair even climbed above the 38.2% Fib retracement level of the last major drop from the 108.46 high to 106.48 low.

However, the upward move was capped by the 107.40 area. Besides, the pair failed to climb above the 50% Fib retracement level of the last major drop from the 108.46 high to 106.48 low.
As a result, there was a short term downside reaction, but the pair is still trading above the 107.00 level. On the upside, there are a few important hurdles forming near the 107.25 and 107.45 levels.
There is also a major bearish trend line forming with resistance near 107.25 on the hourly chart. Therefore, a clear break above the trend line and the 107.45 resistance area is needed for more gains in the near term.
If there is no upside break above 107.45, the USD/JPY pair could start a fresh decline below 107.00 and 106.80.
Trade over 50 forex markets 24 hours a day with FXOpen. Take advantage of low commissions, deep liquidity, and spreads from 0.0 pips. Open your FXOpen account now or learn more about trading forex with FXOpen.
This article represents the opinion of the Companies operating under the FXOpen brand only. It is not to be construed as an offer, solicitation, or recommendation with respect to products and services provided by the Companies operating under the FXOpen brand, nor is it to be considered financial advice.
Stay ahead of the market!
Subscribe now to our mailing list and receive the latest market news and insights delivered directly to your inbox.


Latest articles

Trump’s Comments Spark Rally in Cannabis Stocks
Shares of cannabis-related companies have surged sharply in recent days, as what had previously been market rumours received official confirmation.
According to media reports:
→ The US President confirmed his intention to reclassify cannabis as a Schedule III substance, which would

Analytical Gold Price Predictions for 2026, 2027, and Beyond
Gold continues to attract attention as investors search for a

EUR/NZD Pulls Back From Its December High
Today the EUR/NZD rate touched the 2.4000 level — the highest reading since late November — but then saw a fairly sharp pullback. Fundamentally, the heightened volatility is driven by a combination of factors.
The euro (EUR) is showing strength