


EUR/USD Could Recover Above 1.0900 While EUR/JPY Is Diving
FXOpen
EUR/USD is currently correcting higher and trading above the 1.0820 resistance. Conversely, EUR/JPY is diving and it could continue to decline towards 115.00.
Important Takeaways for EUR/USD and EUR/JPY
- The Euro is showing a few recovery signs and it might climb above 1.0900.
- There is a connecting bullish trend line forming with support near 1.0825 on the hourly chart of EUR/USD.
- EUR/JPY declined heavily below the 116.50 and 116.00 support levels.
- There is a key bearish trend line forming with resistance near 115.90 on the hourly chart.
EUR/USD Technical Analysis
This past week, the Euro extended its decline below the 1.0820 support against the US Dollar. The EUR/USD pair even broke the 1.0760 level before it found support near the 1.0730 level.
Recently, the pair started a decent recovery above the 1.0800 resistance level and the 50 hourly simple moving average. The pair even broke the 1.0850 resistance and traded as high as 1.0888 on FXOpen.
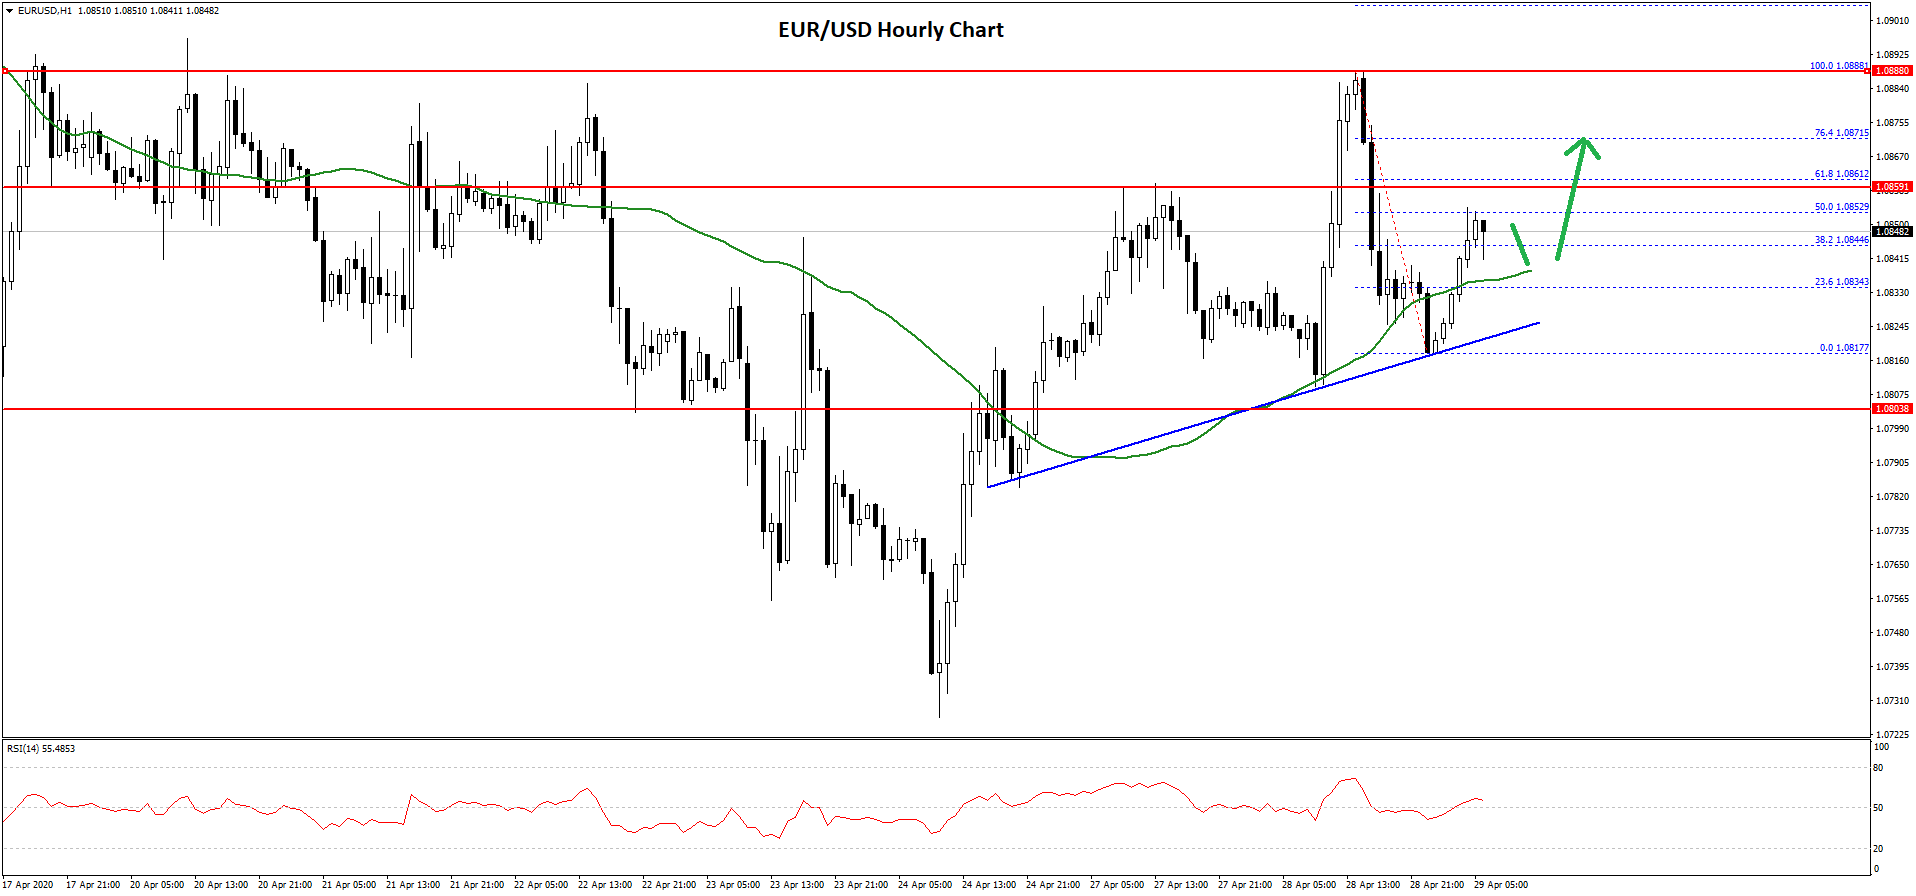
It failed to continue higher and corrected below 1.0840. A low is formed near 1.0817 and the pair is currently rising. It tested the 50% Fib retracement level of the recent decline from the 1.0888 high to 1.0817 low.
On the upside, an initial resistance is near the 1.0860 level. It coincides with the 61.8% Fib retracement level of the recent decline from the 1.0888 high to 1.0817 low.
The main resistance levels are near the 1.0885 and 1.0890 levels, above which EUR/USD could rally towards the 1.0920 and 1.0935 levels. The next major resistance is near the 1.0950 level.
Conversely, the pair might decline below the 1.0840 level or the 50 hourly simple moving average. On the downside, there is a connecting bullish trend line forming with support near 1.0825 on the hourly chart of EUR/USD.
The main support is near the 1.0800 level, below which the bears are likely to aim a fresh decrease towards the 1.0750 and 1.0740 levels.
EUR/JPY Technical Analysis
The Euro started a major decline from well above the 117.00 level against the Japanese Yen. The EUR/JPY pair broke the 116.50 support zone to move into a bearish zone.
The bears remained in action and pushed the pair below the 116.00 support level. There was also a close below the 115.80 level and the 50 hourly simple moving average.
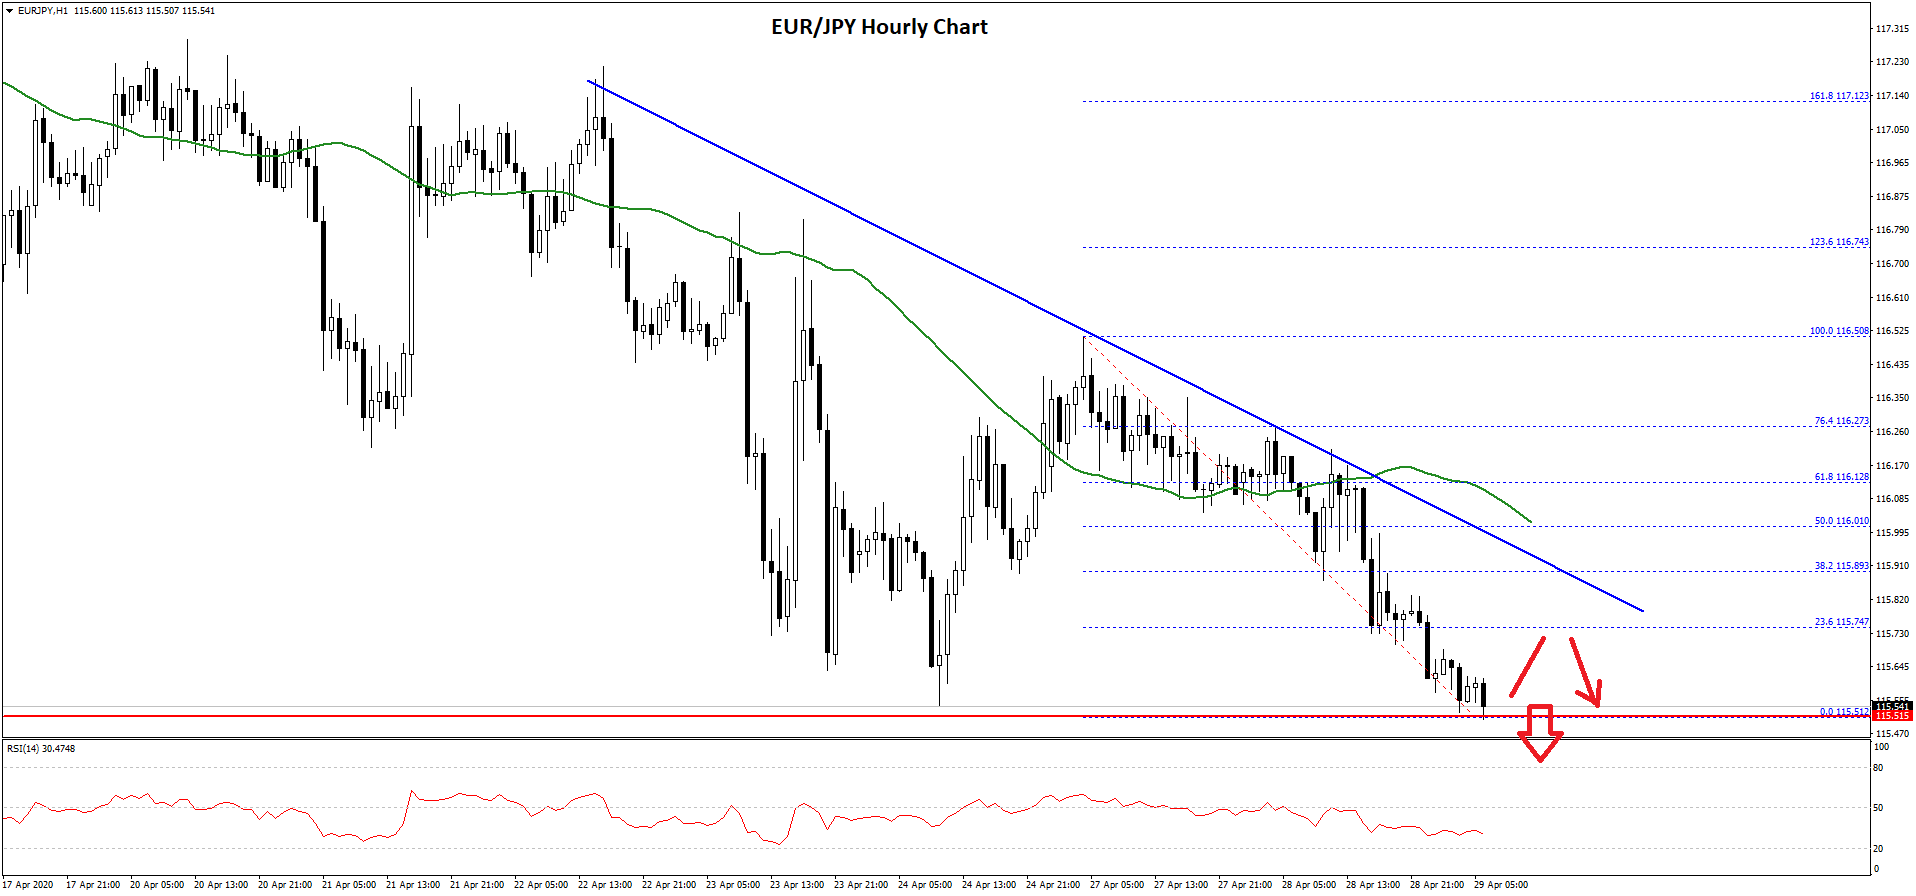
The pair traded as low as 115.51 and it is currently consolidating losses. An initial resistance on the upside is near the 115.75 level. It is close to the 23.6% Fib retracement level of the recent decline from the 116.50 high to 115.51 low.
The first key resistance on the upside is near the 115.90 and 116.00 levels. There is also a key bearish trend line forming with resistance near 115.90 on the hourly chart.
The 50% Fib retracement level of the recent decline from the 116.50 high to 115.51 low is the next hurdle at 116.01 along with the 50 hourly simple moving average.
Therefore, a break above the 115.90 and 116.00 levels is needed for a fresh increase in the near term. Conversely, the pair could continue to move down below 115.50. The next major support for EUR/JOY is near the 115.00 level, followed by the 114.60 zone.
Trade over 50 forex markets 24 hours a day with FXOpen. Take advantage of low commissions, deep liquidity, and spreads from 0.0 pips (additional fees may apply). Open your FXOpen account now or learn more about trading forex with FXOpen.
This article represents the opinion of the Companies operating under the FXOpen brand only. It is not to be construed as an offer, solicitation, or recommendation with respect to products and services provided by the Companies operating under the FXOpen brand, nor is it to be considered financial advice.
Stay ahead of the market!
Subscribe now to our mailing list and receive the latest market news and insights delivered directly to your inbox.


Latest articles

EUR/USD Eyes Gains As USD/CHF Weakness Deepens Again
EUR/USD started a fresh increase above 1.1700 and 1.1720. USD/CHF declined further and is now struggling below 0.7835.
Important Takeaways for EUR/USD and USD/CHF Analysis Today
· The Euro started a decent increase from

Apple: Earnings Day Above the Activity Zone
On 30 April, after the market close, Apple Inc. will release its financial results for the second quarter of fiscal 2026. The consensus forecast, based on estimates from 31 analysts, points to revenue of around $109.7 billion, with expected

USD/JPY and USD/CHF Near Key Levels: The Dollar Supported by the Fed
The US dollar continues to trend upwards following the Federal Reserve meeting, drawing support from the regulator’s moderately hawkish stance and comments by Jerome Powell. Markets interpret the Fed’s rhetoric as a signal that restrictive policy is likely