


EUR/USD Could Resume Decline While USD/JPY Aims Higher
FXOpen

EUR/USD extended its increase before it faced sellers near 1.1910. USD/JPY is rising and it might revisit the 110.40 resistance zone.
Important Takeaways for EUR/USD and USD/JPY
· The Euro failed to gain pace above 1.1900 and started a downside correction.
· There was a break below a major bullish trend line with support near 1.1875 on the hourly chart of EUR/USD.
· USD/JPY started a fresh increase and it cleared the 110.00 resistance zone.
· There was a break above a key bearish trend line with resistance near 109.95 on the hourly chart.
EUR/USD Technical Analysis
This past week, the Euro saw a steady increase above the 1.1800 zone against the US Dollar. The EUR/USD pair broke the 1.1850 resistance to move into a positive zone.
The pair even spiked above the 1.1900 level, but it failed to extend gains. A high was formed near 1.1908 on FXOpen before the pair started a fresh decline. There was a break below the 1.1880 support level and the 50 hourly simple moving average.
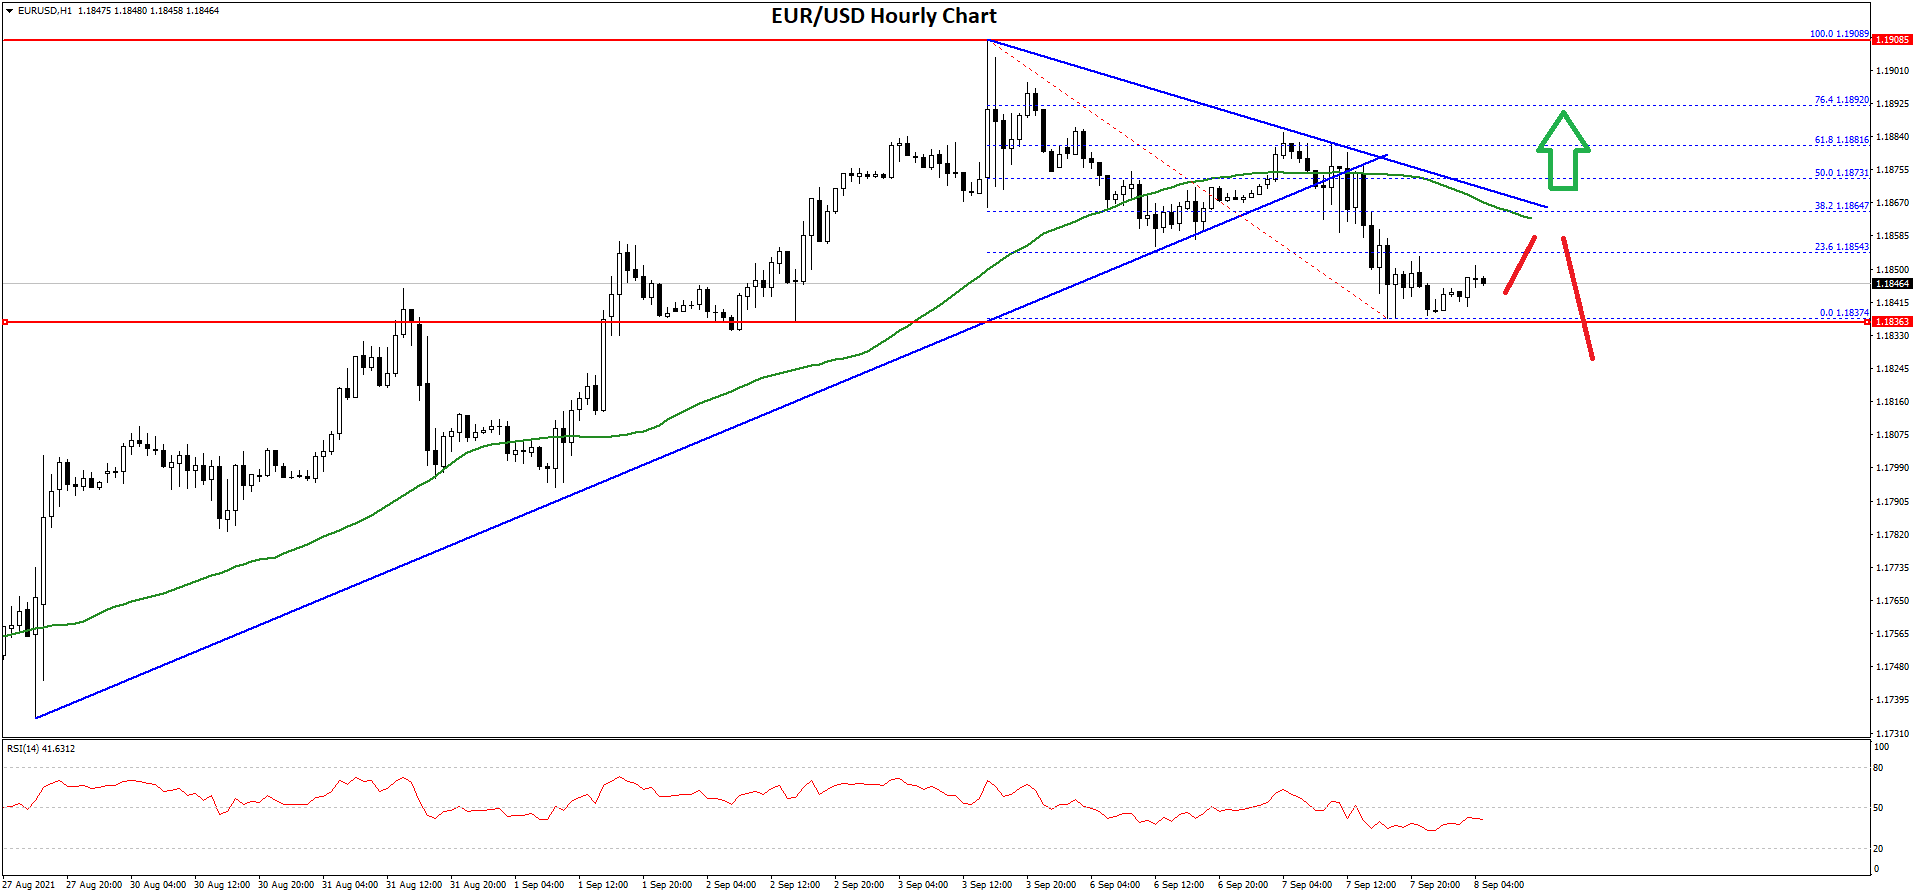
There was also a break below a major bullish trend line with support near 1.1875 on the hourly chart of EUR/USD. The pair traded as low as 1.1837 and it is now consolidating losses.
An immediate resistance is near the 1.1855 level. It is near the 23.6% Fib retracement level of the recent decline from the 1.1908 swing high to 1.1837 low. The first key resistance is near the 1.1865 level and the 50 hourly simple moving average.
The 50% Fib retracement level of the recent decline from the 1.1908 swing high to 1.1837 low is also near 1.1865. A close above 1.1865 could open the doors for a steady increase towards 1.1900.
If there is no break above 1.1865, the pair might continue to move down. An immediate support is near the 1.1840. The next major support is near 1.1820, below which the pair could drop towards the 1.1750 support in the near term.
USD/JPY Technical Analysis
The US Dollar started a fresh increase from the 109.60 support zone against the Japanese Yen. The USD/JPY pair broke the 109.80 and 110.00 resistance levels to move into a positive zone.
The pair broke the 50% Fib retracement level of the key decline from the 110.41 high to 109.59 low. There was also a break above a key bearish trend line with resistance near 109.95 on the hourly chart.
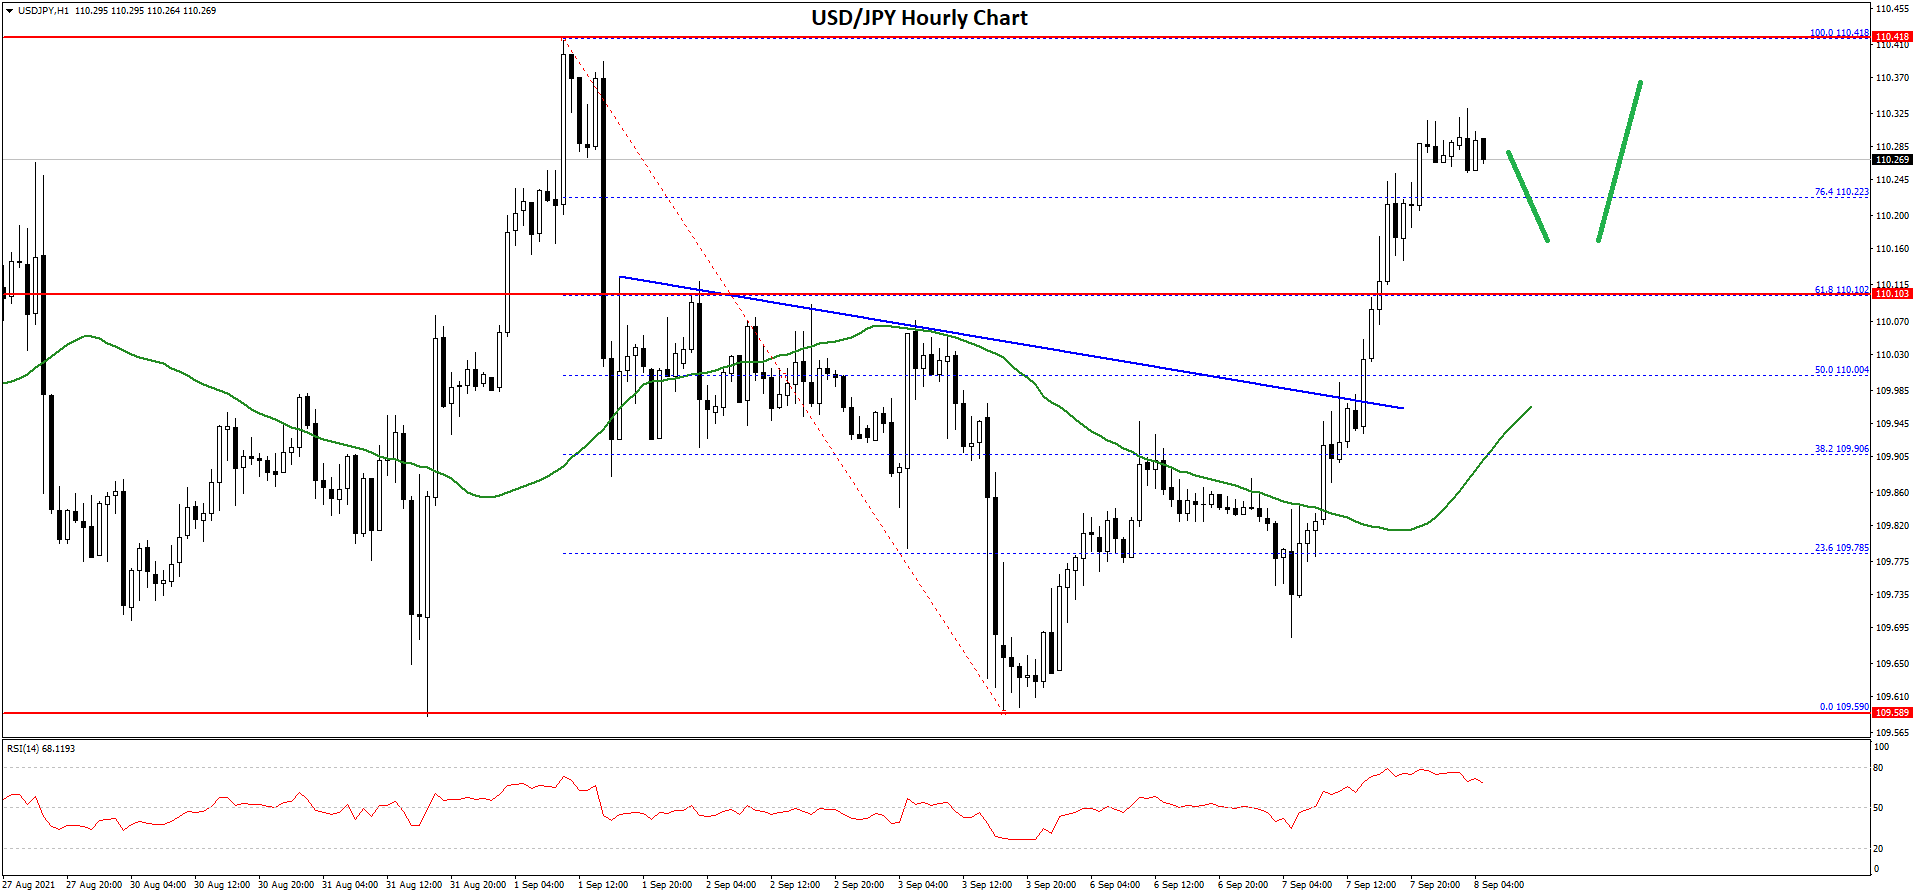
The pair is now trading above the 110.20 level and the 50 hourly simple moving average. It seems to be consolidating above the 76.4% Fib retracement level of the key decline from the 110.41 high to 109.59 low.
On the upside, an initial resistance is near the 110.35 level. The next major resistance is near the 110.40 level, above which the pair is likely to rise steadily in the coming sessions.
An initial support on the downside is near the 110.20 level. The first major support is now forming near the 110.10 level. If there is a downside break below the 110.10 support, the pair could decline towards the 109.80. Any more losses could open the doors for a move towards the 109.60 support zone. The next key support could be 109.20.
This forecast represents FXOpen Markets Limited opinion only, it should not be construed as an offer, invitation or recommendation in respect to FXOpen Markets Limited products and services or as financial advice.
This article represents the opinion of the Companies operating under the FXOpen brand only. It is not to be construed as an offer, solicitation, or recommendation with respect to products and services provided by the Companies operating under the FXOpen brand, nor is it to be considered financial advice.
Stay ahead of the market!
Subscribe now to our mailing list and receive the latest market news and insights delivered directly to your inbox.

Latest articles

Pound at Key Levels: Markets Assess Impact of Political Uncertainty in the UK
The British pound remains under pressure following increased political uncertainty in the United Kingdom triggered by the Prime Minister’s resignation. Investors are assessing potential shifts in the political and economic policy outlook after the head of government stepped down,

Silver: Fed Tightens Its Tone as Price Returns to the Volume Profile Zone
Silver came under pressure following the Federal Reserve’s June meeting, at which policymakers kept interest rates unchanged at 3.50–3.75%. Nine of the 18 committee members still see the possibility of a rate increase this year, reinforcing

Ethereum: Market Assesses the Strength of the Corrective Recovery
Following a period of heightened volatility in early June, investor attention in Ethereum has once again shifted towards institutional demand and the development of the spot ETF market in the United States. The funds launched last year continue to serve