


EUR/USD Could Rise, USD/JPY Remains In Strong Uptrend
FXOpen

EUR/USD struggled near 1.0580 and corrected lower. USD/JPY is rising and might continue to gain pace towards the 138.00 resistance
Important Takeaways for EUR/USD and USD/JPY
· The Euro started a downside correction after it failed to surpass 1.0580.
· There is a key bullish trend line forming with support near 1.0505 on the hourly chart of EUR/USD.
· USD/JPY gained pace after it broke the 135.00 resistance zone.
· It surpassed a major bearish trend line with resistance near 135.35 on the hourly chart.
EUR/USD Technical Analysis
This past week, the Euro started a decent recovery wave above the 1.0500 level against the US Dollar. The EUR/USD pair cleared the 1.0520 and 1.0550 resistance levels.
However, the pair faced sellers near the 1.0580 level. A high was formed near 1.0582 on FXOpen and EUR/USD started a downside correction. There was a move below the 1.0520 support and the 50 hourly simple moving average.
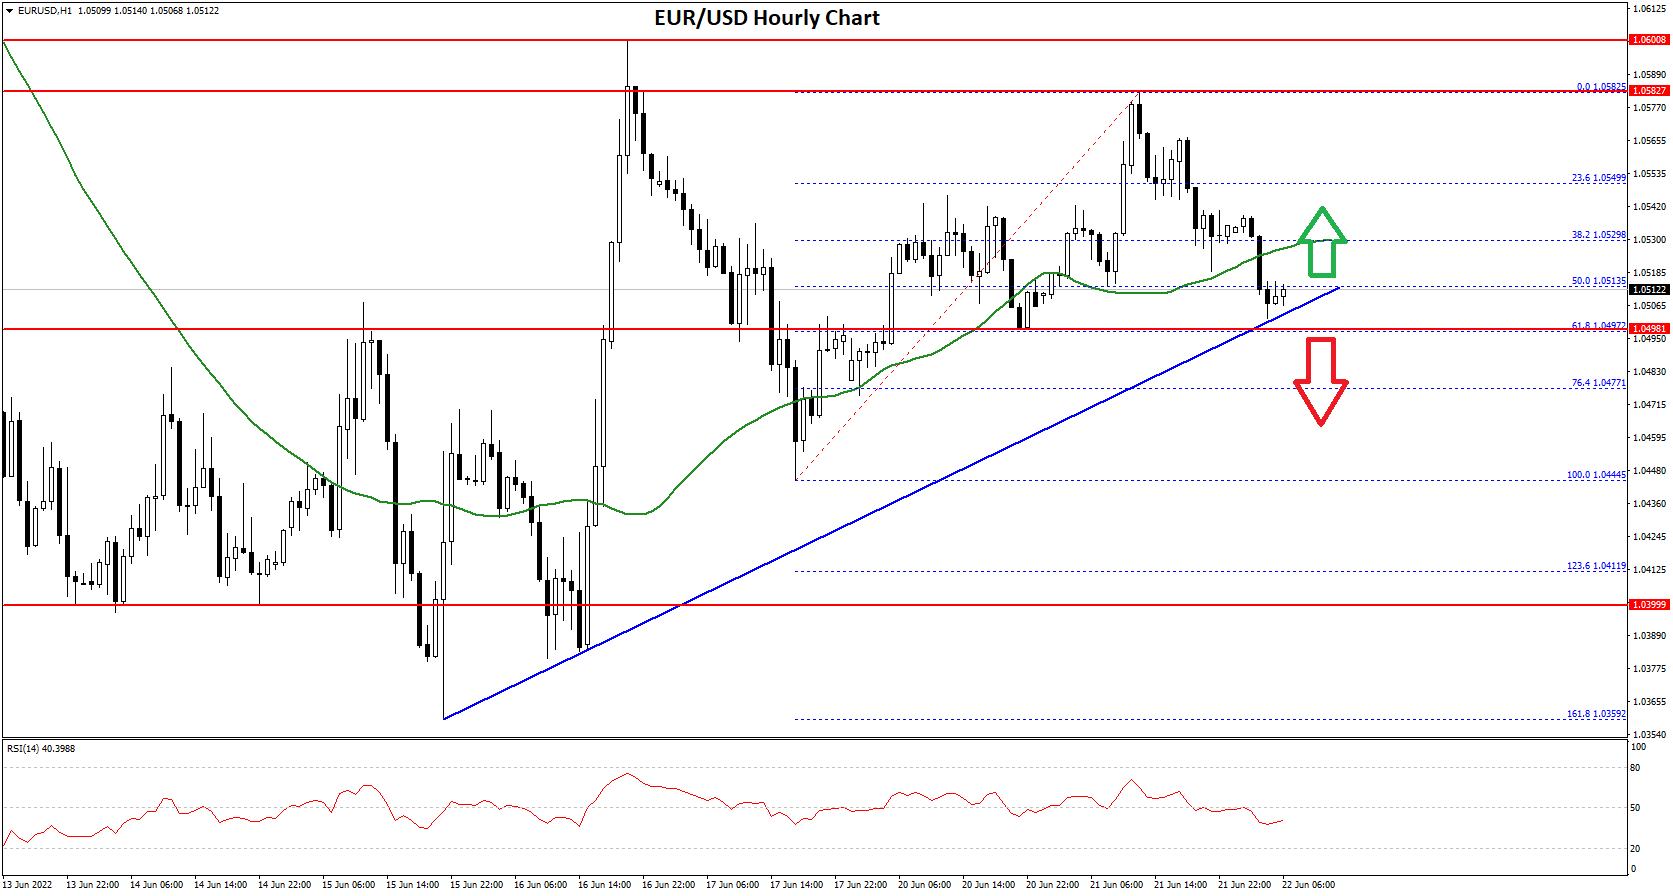
The pair even spiked below the 50% Fib retracement level of the upward move from the 1.0444 swing low to 1.0582 high. However, the bulls are now protecting the 1.0500 support zone.
There is also a key bullish trend line forming with support near 1.0505 on the hourly chart of EUR/USD. The trend line is close to the 61.8% Fib retracement level of the upward move from the 1.0444 swing low to 1.0582 high.
An immediate resistance on the upside is near the 1.0530 level the 50 hourly simple moving average. The next major resistance is near the 1.0550 level. The main resistance is near the 1.0580 level. An upside break above 1.0580 could set the pace for a steady increase.
If not, the pair might drop and test the 1.0480 support. The next major support is near 1.0450, below which the pair could drop to 1.0400 in the near term.
USD/JPY Technical Analysis
The US Dollar started a downside correction from the 135.50 resistance zone against the Japanese Yen. The USD/JPY pair traded below the 133.00 support zone.
It traded as low as 131.49 before the bulls emerged. The pair started a fresh increase above the 132.50 resistance and the 50 hourly simple moving average. There was a break above a major bearish trend line with resistance near 135.35 on the hourly chart.
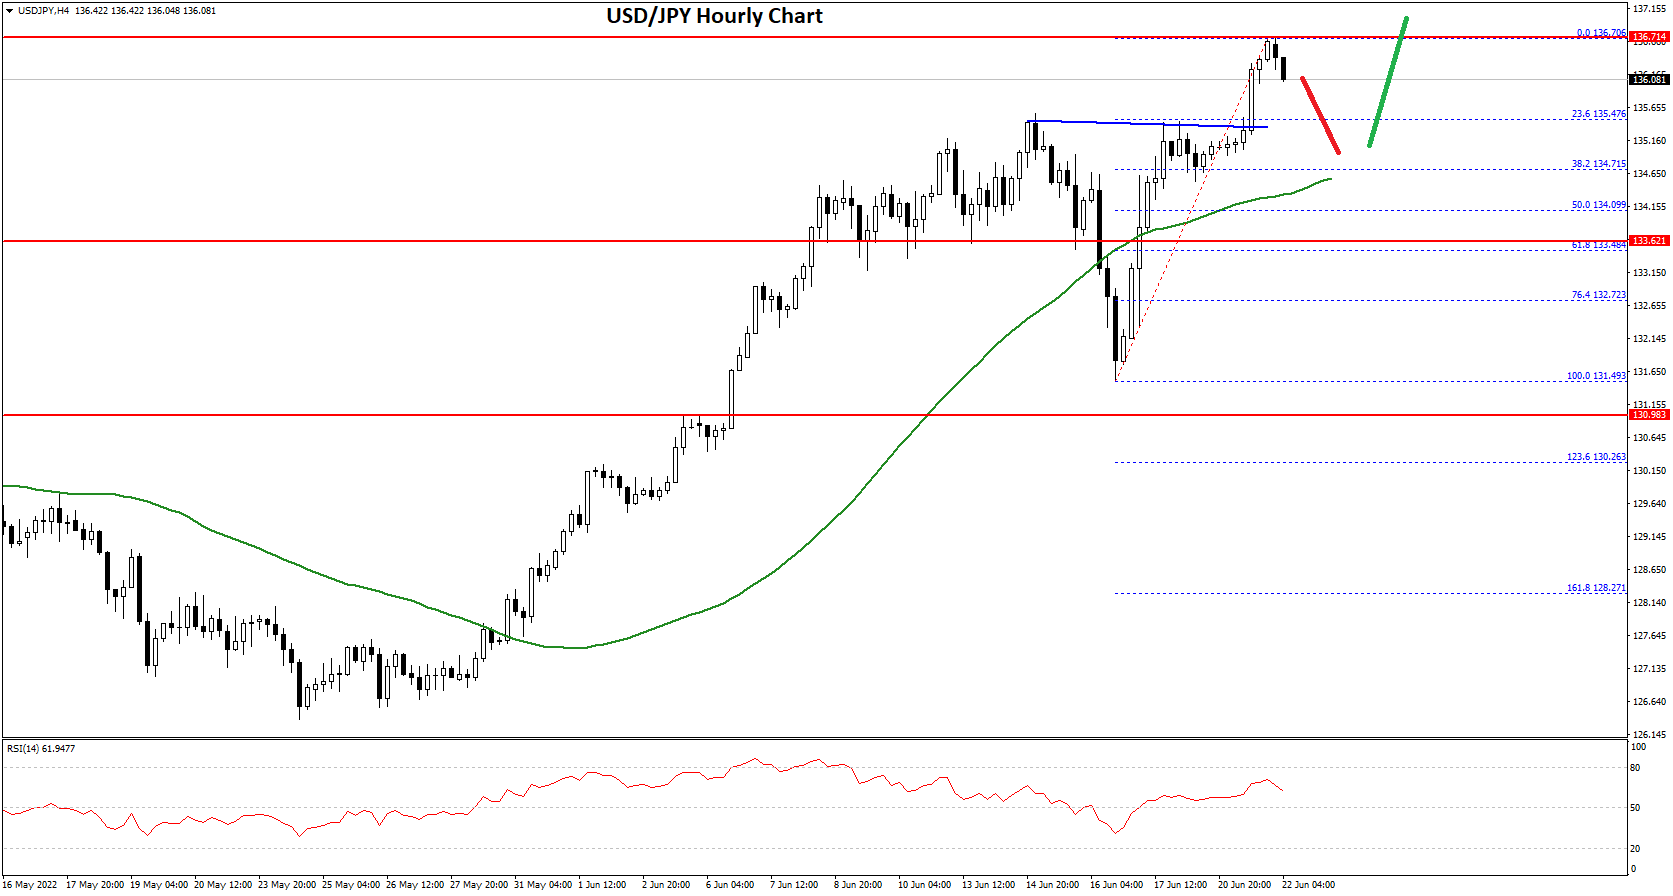
The upward move gained pace and the pair traded to a new multi-year high at 136.70. It is now consolidating gains and trading well above the 23.6% Fib retracement level of the upward move from the 131.49 swing low to 136.70 high.
An initial support on the downside is near the 135.50 level. The next major support is near the 134.00 level. It is near the 50% Fib retracement level of the upward move from the 131.49 swing low to 136.70 high.
Any more downsides might lead the pair towards the 132.50 support zone, below which the bears might aim a test of the 130.00 support zone.
On the upside, an initial resistance is near the 136.70 level. The next major resistance is near the 137.20. Any more gains could send the pair towards the 138.00 level. The next key hurdle is near the 140.00 level.
This forecast represents FXOpen Markets Limited opinion only, it should not be construed as an offer, invitation or recommendation in respect to FXOpen Markets Limited products and services or as financial advice.
Trade over 50 forex markets 24 hours a day with FXOpen. Take advantage of low commissions, deep liquidity, and spreads from 0.0 pips (additional fees may apply). Open your FXOpen account now or learn more about trading forex with FXOpen.
This article represents the opinion of the Companies operating under the FXOpen brand only. It is not to be construed as an offer, solicitation, or recommendation with respect to products and services provided by the Companies operating under the FXOpen brand, nor is it to be considered financial advice.
Stay ahead of the market!
Subscribe now to our mailing list and receive the latest market news and insights delivered directly to your inbox.


Latest articles

US Dollar Index: A Defining Week for the King of the Markets
The dollar heads into a pivotal week trading near 101.80, just off a 15-month high, with the Fed's July 29 meeting standing as the clear focal point. Markets currently price roughly a 65% chance of a hold, though renewed

NZD/USD: Inflation Surge Meets Strong US Dollar Pressure
On 21 July, Stats NZ reported an acceleration in inflation: the Consumer Price Index rose 1.5% in the second quarter, while the annual inflation rate climbed to 4.1%, its highest level in more than two years and slightly

Weekly Market Insights with Gary Thomson: The Week of Central Banks and Earnings
In this video, we’ll explore the key economic events and market trends, shaping the financial landscape. Get ready for insights into financial markets to help you navigate the week ahead. Let’s dive in!
In this episode of Market