


EUR/USD Dives Again, USD/JPY Breaking Down
FXOpen

EUR/USD topped near the 1.1175 level and started a fresh decline below 1.1120. USD/JPY is also showing bearish signs and it could continue to move down towards 108.70.
Important Takeaways for EUR/USD and USD/JPY
- The Euro started a fresh decline after it failed to clear the 1.1175 resistance area.
- There was a break below a key bullish trend line with support near 1.1115 on the hourly chart of EUR/USD.
- USD/JPY is showing a few bearish signs below the 109.25 resistance area.
- The pair is struggling to stay above a major bullish trend line with support near 109.00 on the hourly chart.
EUR/USD Technical Analysis
The Euro made a few attempts to break the 1.1175 and 1.1180 resistance levels against the US Dollar. However, the EUR/USD pair failed to continue above 1.11750, resulting in a bearish reaction.
There was a sharp decline below the 1.1150 support area and the 50 hourly simple moving average. It opened the doors for more losses below the 1.1120 and 1.1100 support levels.
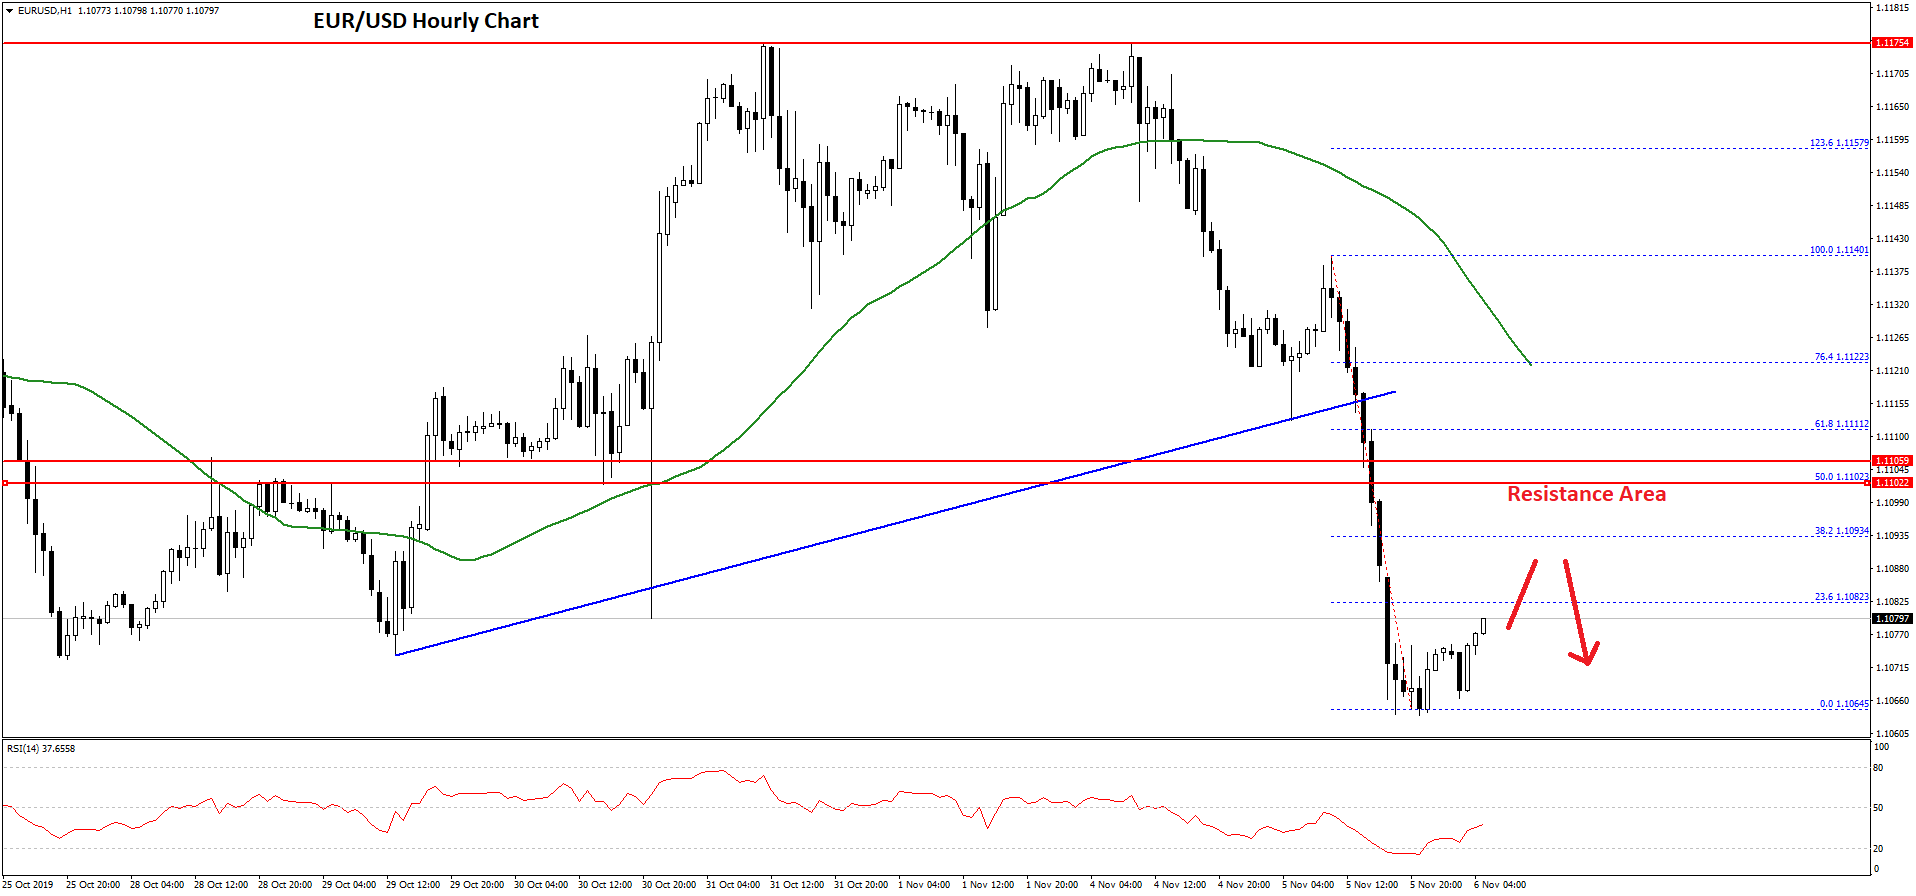
Moreover, there was a break below a key bullish trend line with support near 1.1115 on the hourly chart of EUR/USD. The pair even traded below the 1.1080 support area and formed a low near 1.1064 on FXOpen.
It is currently consolidating losses above the 1.1065 support area. On the upside, an initial resistance is near the 1.1080 level. It represents the 23.6% Fib retracement level of the recent decline from the 1.1140 high to 1.1064 low.
On the upside, the main resistance for the bulls is near the 1.1100 area. It also coincides with the 50% Fib retracement level of the recent decline from the 1.1140 high to 1.1064 low.
On the downside, an initial support is near the 1.1065 level. If there are more downsides, EUR/USD could continue to move down towards the 1.1040 and 1.1025 support levels in the coming sessions.
USD/JPY Technical Analysis
The US Dollar remained in a positive zone above the 108.00 and 108.20 support levels against the Japanese Yen. As a result, the USD/JPY pair climbed above the 108.50 resistance area.
The pair even broke the 109.00 resistance area and the 50 hourly simple moving average. However, the pair seems to be facing a strong resistance near the 109.25 area.
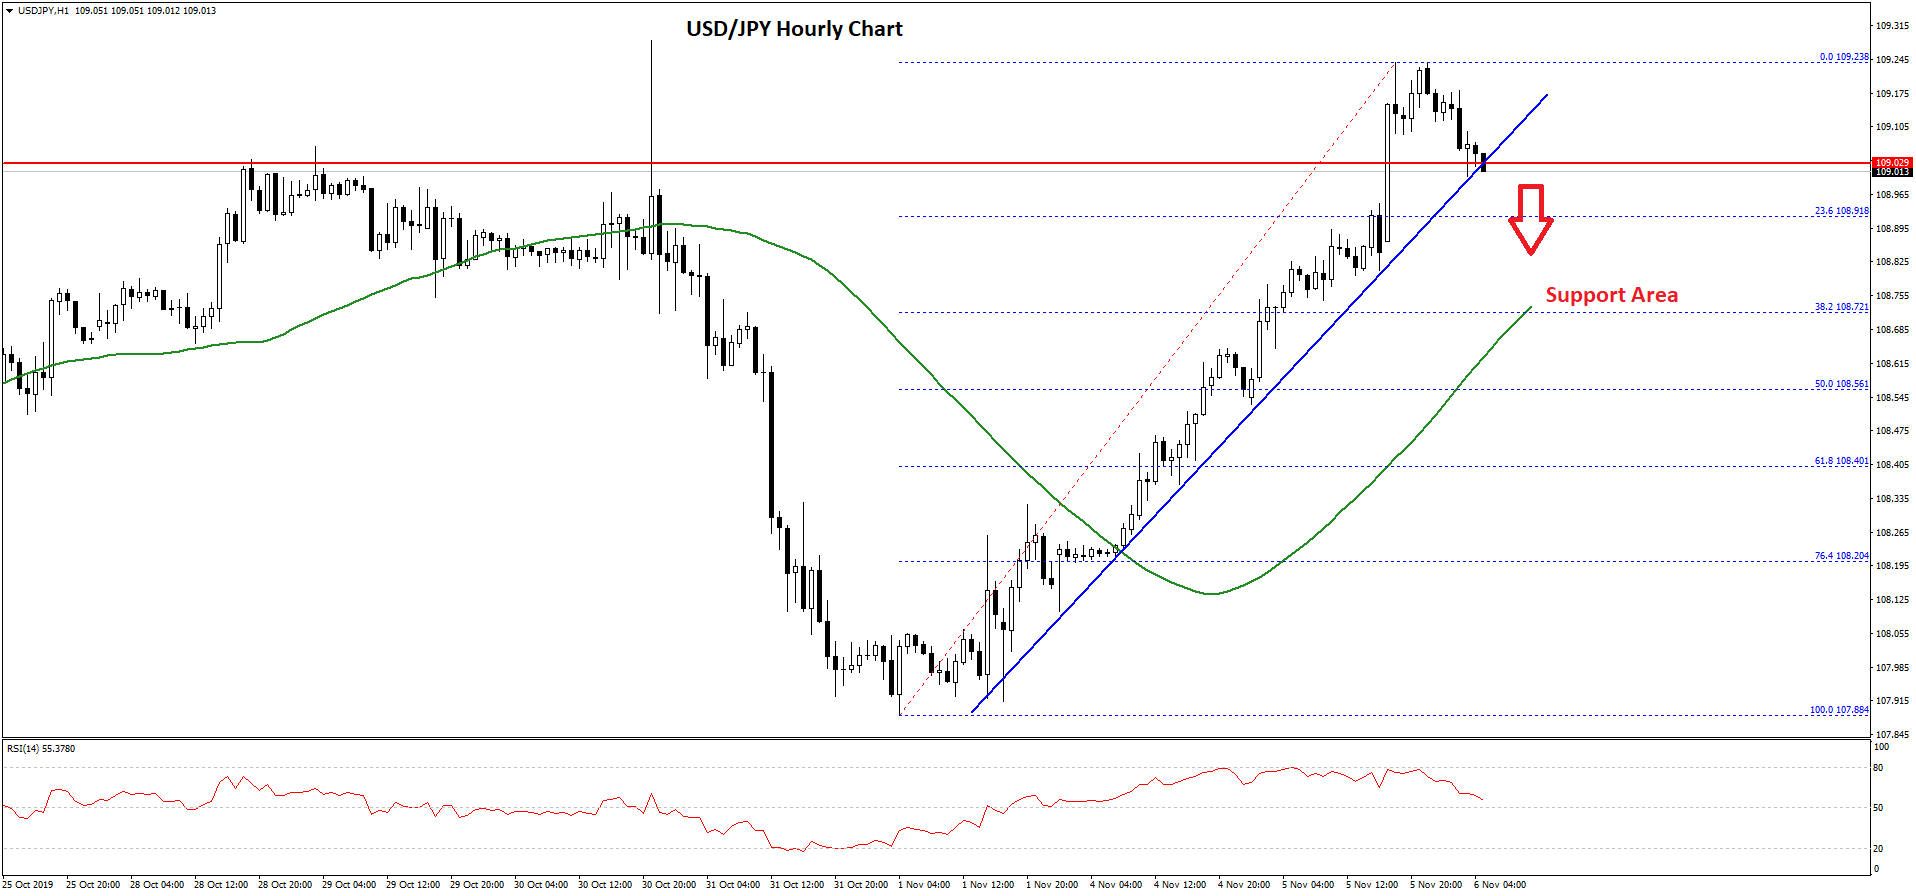
It is currently correcting lower below 109.10. More importantly, the pair is struggling to stay above a major bullish trend line with support near 109.00 on the hourly chart.
If there is a downside break, the pair could test the 108.70 support are and the 50 hourly simple moving average. It also coincides with the 38.2% Fib retracement level of the upward move from the 107.88 low to 109.23 high.
If there are more downsides, the next stop could be near the 108.55 level. It coincides with the 50% Fib retracement level of the upward move from the 107.88 low to 109.23 high.
On the upside, the main resistance is near the 109.25 level. If there is a clear break above the 109.25 level, there are chances of more gains above the 109.40 and 109.50 levels.
Overall, USD/JPY is showing a few bearish signs and there is a risk of more downsides below the 109.00 and 108.80 levels in the near term.
Trade over 50 forex markets 24 hours a day with FXOpen. Take advantage of low commissions, deep liquidity, and spreads from 0.0 pips (additional fees may apply). Open your FXOpen account now or learn more about trading forex with FXOpen.
This article represents the opinion of the Companies operating under the FXOpen brand only. It is not to be construed as an offer, solicitation, or recommendation with respect to products and services provided by the Companies operating under the FXOpen brand, nor is it to be considered financial advice.
Stay ahead of the market!
Subscribe now to our mailing list and receive the latest market news and insights delivered directly to your inbox.


Latest articles

US Dollar Strengthens Amid Equity Market Weakness and Hawkish Fed Rhetoric
The US dollar continues to hold firm near multi-year highs as sentiment across equity markets deteriorates and investors increasingly expect the Federal Reserve to maintain a restrictive monetary policy stance for longer. The US economy remains resilient, while inflation risks

Bitcoin: Corrective Channel Broken as Traders Turn More Active
Bitcoin has come under the influence of several factors simultaneously. The wave of selling at the beginning of June was linked to Strategy's first disclosed Bitcoin sale in several years, a prolonged series of outflows from spot ETFs, and a

DAX 40: consolidation amid technology sell-off
A wave of selling in the technology sector that emerged earlier this week has weighed on European equities. The trigger was investor concern over the profitability of large-scale debt-funded investments by major US tech companies in AI infrastructure. The Nasdaq