


EUR/USD Diving While USD/CHF Is Showing Positive Signs
FXOpen
EUR/USD failed to continue above the 1.1100 resistance area and decline recently below 1.1070. Conversely. USD/CHF is climbing higher and showing positive signs above 0.9680.
Important Takeaways for EUR/USD and USD/CHF
- The Euro topped near the 1.1095 level and declined recently against the US Dollar.
- There was a break below a key bullish trend line with support at 1.1052 on the hourly chart of EUR/USD.
- USD/CHF is rising steadily above the 0.9650 and 0.9660 levels.
- There is a major ascending channel forming with support near the 0.9692 level on the hourly chart.
EUR/USD Technical Analysis
This past week, the Euro started a decent recovery above the 1.1040 resistance area against the US Dollar. The EUR/USD pair even broke the 1.1080 resistance area, but it struggled to climb above the 1.1100 resistance area.
A high was formed near 1.1095 on FXOpen and the pair started a fresh decline. It broke the 1.1080 and 1.1070 levels to move into a bearish zone.
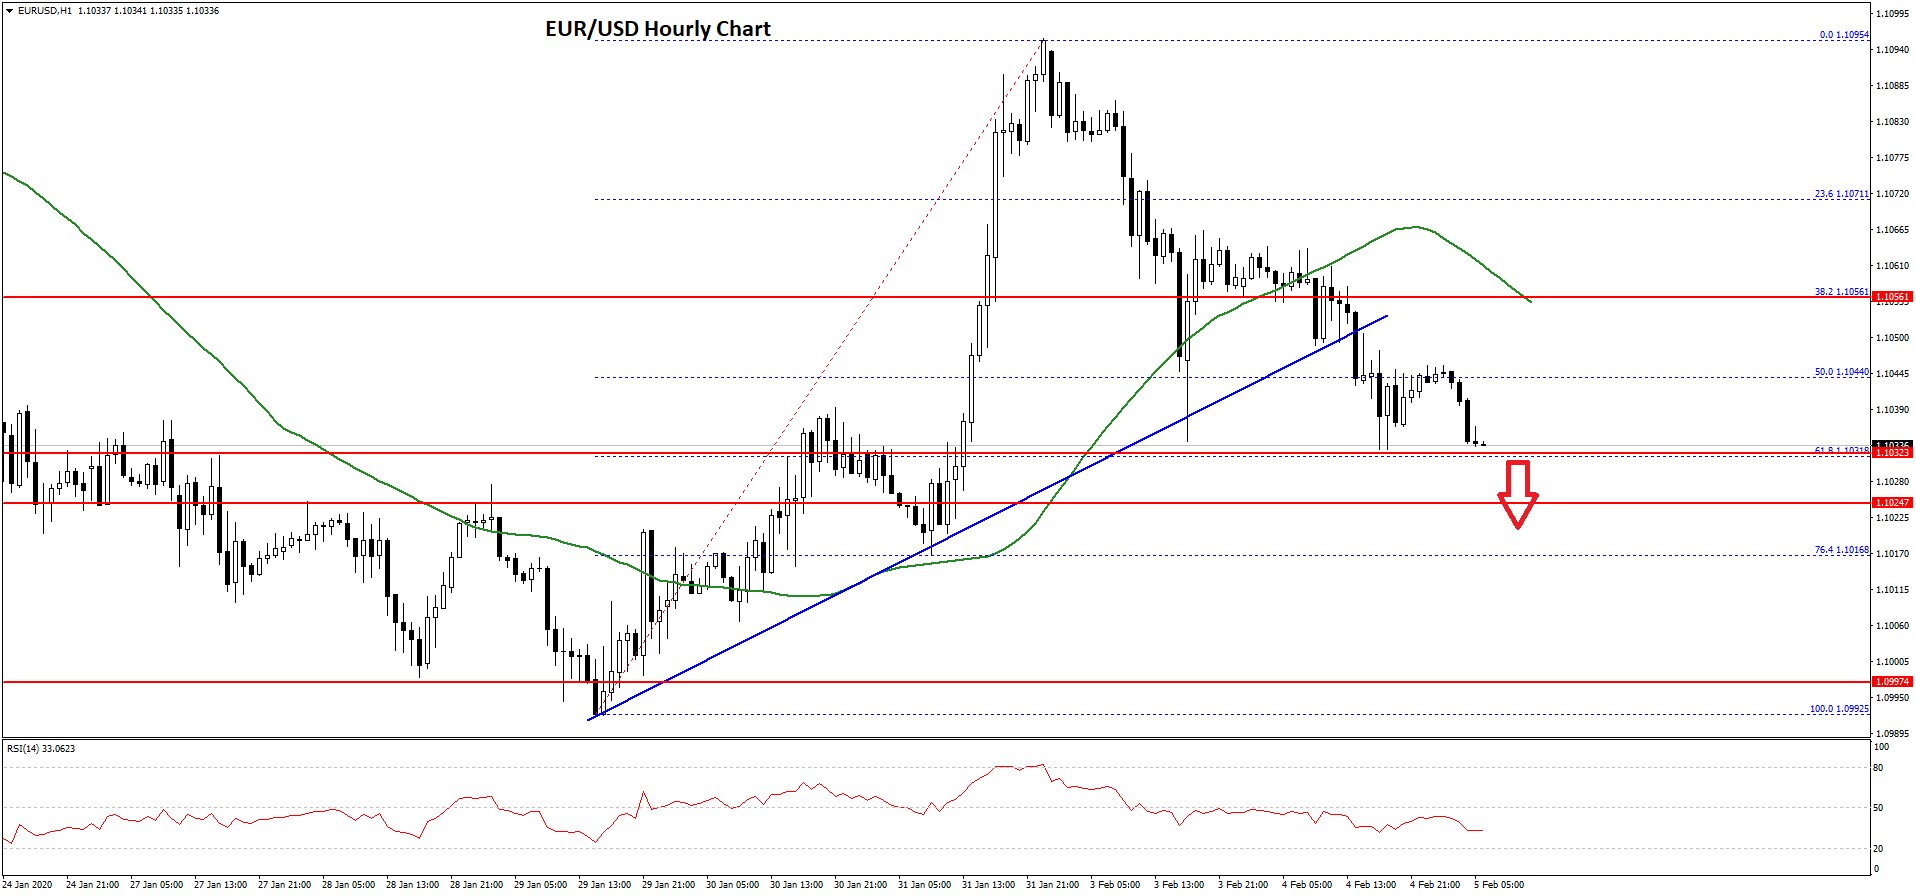
Moreover, there was a close below the 1.1050 level and the 50 hourly simple moving average. The pair even traded below the 50% Fib retracement level of the upward move from the 1.0992 low to 1.1095 high.
During the decline, there was a break below a key bullish trend line with support at 1.1052 on the hourly chart of EUR/USD. The pair is now trading near the 1.1030-1.1035 support area.
Besides, the 61.8% Fib retracement level of the upward move from the 1.0992 low to 1.1095 high is also near the 1.1035 level. If there is a downside break below the 1.1035 level, there are chances of a strong decline.
The next major support is near the 1.1015 level, below which the bears are likely to aim a test of 1.1000. On the upside, the 1.1045 level is an initial resistance. The main resistance for EUR/USD is now near the 1.1055 level and the 50 hourly simple moving average.
USD/CHF Technical Analysis
The US Dollar found support near the 0.9630 level and started a fresh increase against the Swiss franc. The USD/CHF pair broke the 0.9650 and 0.9660 resistance levels to move back into a bullish zone.
Moreover, there was a break above a connecting bearish trend line at 0.9660 on the hourly chart. The pair even settled above the 0.9680 level and the 50 hourly simple moving average.
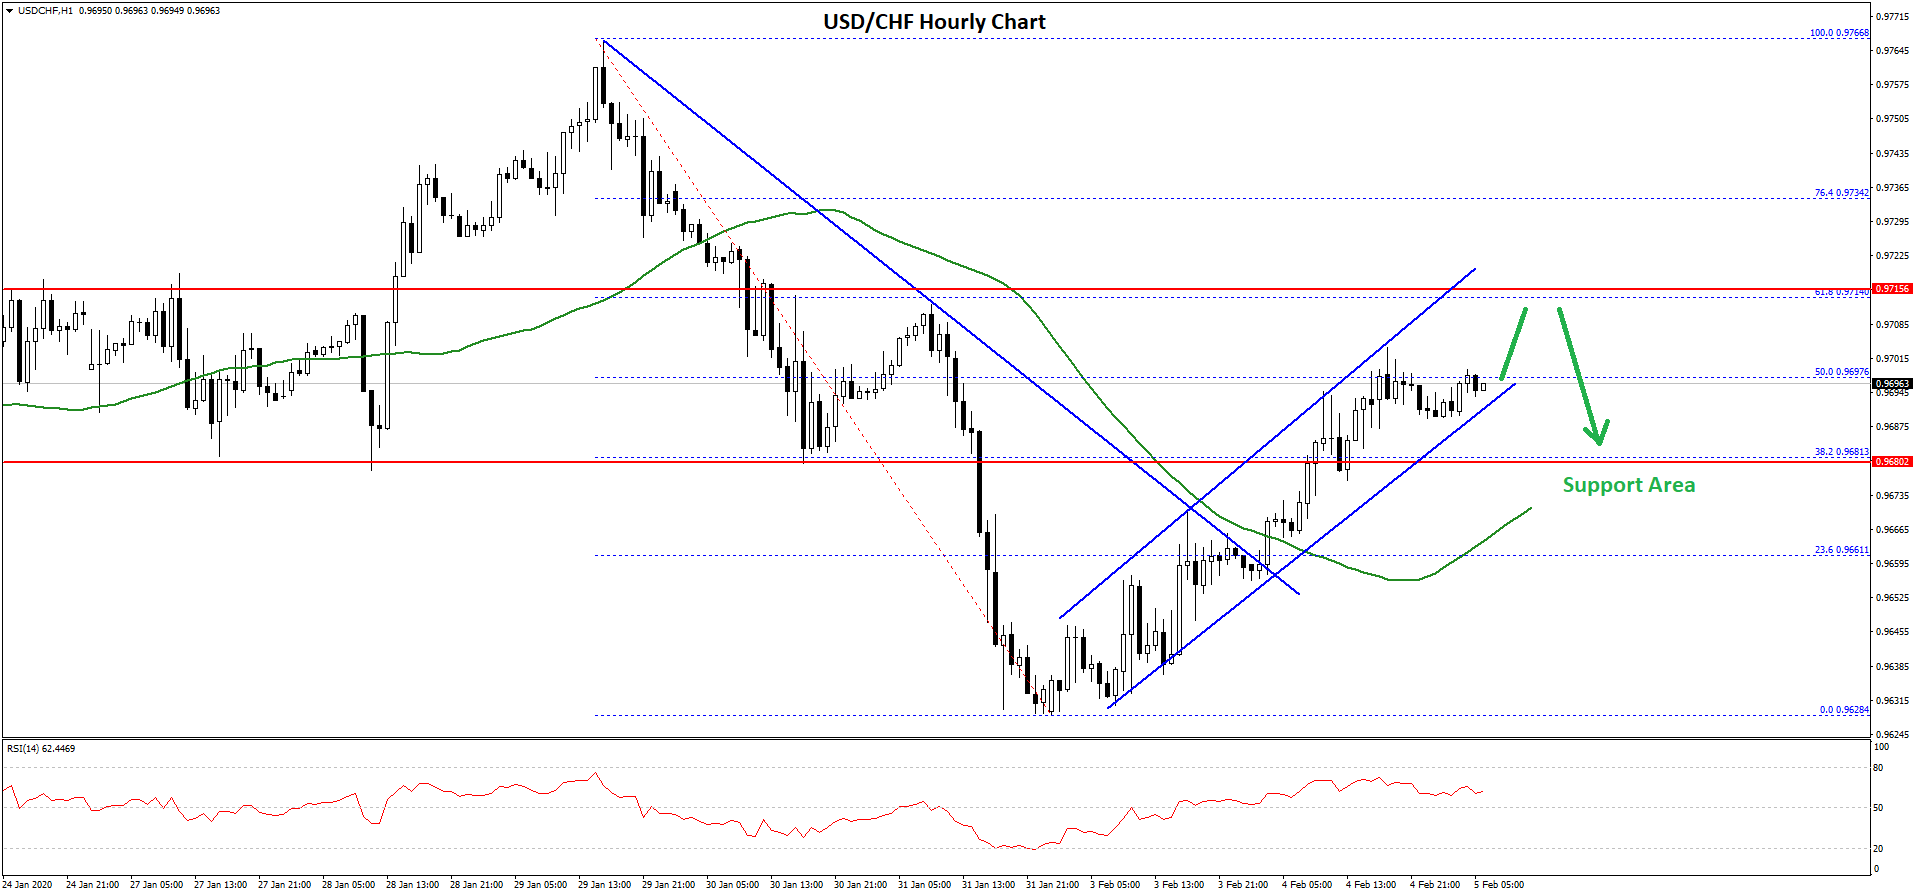
It opened the doors for more gains above the 38.2% Fib retracement level of the last decline from the 0.9766 high to 0.9628 low. At the outset, the pair is following a major ascending channel with support near the 0.9692 level on the same chart.
An immediate resistance is near the 0.9700 level, plus the 50% Fib retracement level of the last decline from the 0.9766 high to 0.9628 low.
The main hurdle is near the 0.9715 level, above which there are chances of a strong rise in the near term. In the mentioned case, the pair could even test the 0.9750 level.
On the downside, there are many supports near 0.9680 and 0.9660. If the USD/CHF pair fails to stay above the 0.9660 support, there is a risk of a drop towards the 0.9625 level. The next key support is near the 0.9600 area.
Trade over 50 forex markets 24 hours a day with FXOpen. Take advantage of low commissions, deep liquidity, and spreads from 0.0 pips (additional fees may apply). Open your FXOpen account now or learn more about trading forex with FXOpen.
This article represents the opinion of the Companies operating under the FXOpen brand only. It is not to be construed as an offer, solicitation, or recommendation with respect to products and services provided by the Companies operating under the FXOpen brand, nor is it to be considered financial advice.
Stay ahead of the market!
Subscribe now to our mailing list and receive the latest market news and insights delivered directly to your inbox.


Latest articles

Pound at Key Levels: Markets Assess Impact of Political Uncertainty in the UK
The British pound remains under pressure following increased political uncertainty in the United Kingdom triggered by the Prime Minister’s resignation. Investors are assessing potential shifts in the political and economic policy outlook after the head of government stepped down,

Silver: Fed Tightens Its Tone as Price Returns to the Volume Profile Zone
Silver came under pressure following the Federal Reserve’s June meeting, at which policymakers kept interest rates unchanged at 3.50–3.75%. Nine of the 18 committee members still see the possibility of a rate increase this year, reinforcing

Ethereum: Market Assesses the Strength of the Corrective Recovery
Following a period of heightened volatility in early June, investor attention in Ethereum has once again shifted towards institutional demand and the development of the spot ETF market in the United States. The funds launched last year continue to serve