


EUR/USD Eyeing Upside Break, USD/CHF Extended Slides
FXOpen
EUR/USD recovered recently and traded above the 1.1420 resistance. USD/CHF is currently under pressure and it could continue to move down towards 0.9990 or 0.9970.
Important Takeaways for EUR/USD and USD/CHF
- The Euro formed a decent support near 1.1360 and recovered recently against the US Dollar.
- There is a major bullish trend line in place with support at 1.1415 on the hourly chart of EUR/USD.
- USD/CHF is currently following a key bearish trend line with resistance at 1.0035 on the hourly chart.
- The pair may continue to decline towards the 0.9990 or 0.9970 support level.
EUR/USD Technical Analysis
The Euro found a strong support near the 1.1300-1.1310 zone this week against the US Dollar. The EUR/USD pair started an upward move and recovered above 1.1360 and 1.1400.
The recent recovered was convincing as there was a close above the 1.1360 resistance and the 50 hourly simple moving average. An intermediate swing low was formed at 1.1353 before the pair rallied above 1.1400.
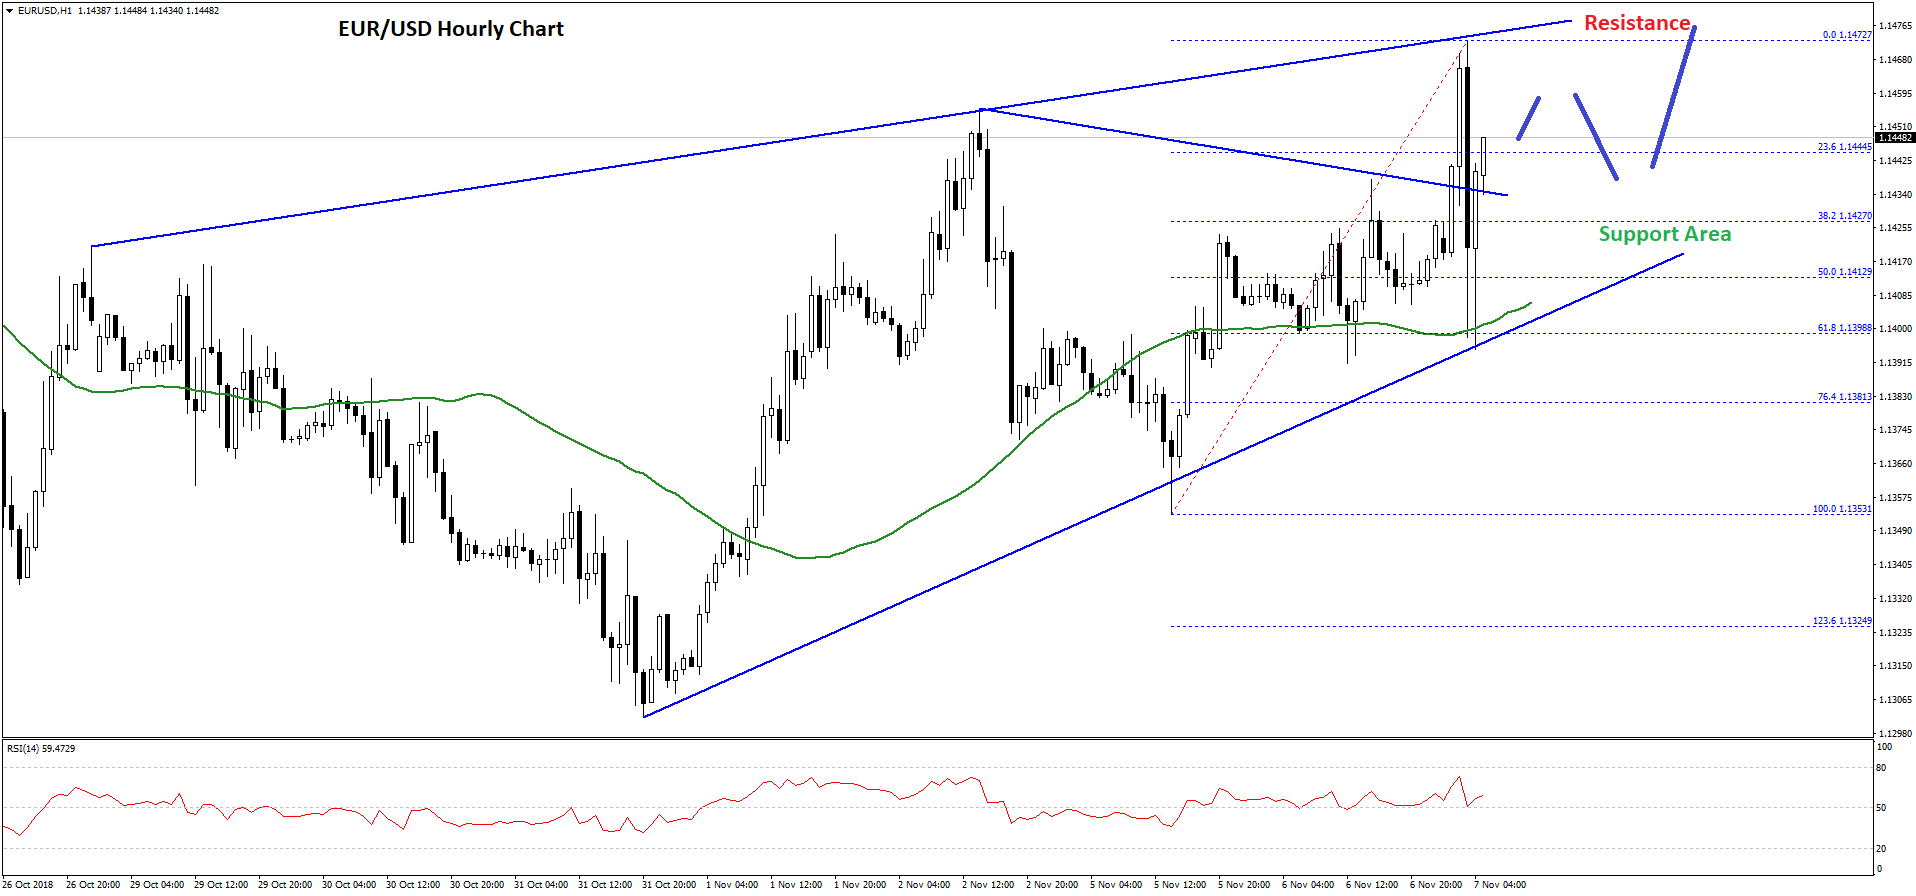
The pair recently traded as high as 1.1472 where sellers emerged, resulting in a sharp downside correction. Sellers pushed the pair below the 1.1420 level and the 50% Fib retracement level of the last wave from the 1.1353 low to 1.1472 high.
However, losses were contained near the 1.1400 handle and the 50 hourly simple moving average. Moreover, the 61.8% Fib retracement level of the last wave from the 1.1353 low to 1.1472 high also acted as a strong support.
Finally, there is a major bullish trend line in place with support at 1.1415 on the hourly chart, which is another strong support for buyers. Therefore, the pair may bounce back and it could soon break the 1.1472 swing high in the near term.
The next key resistance for buyers in near the 1.1500 zone, above which the pair may trade towards 1.1540. On the downside, the 1.1420 level is a solid support followed by the 1.1400 handle and the 50 hourly SMA.
USD/CHF Technical Analysis
The US Dollar started a bearish wave from the 1.0095 swing high against the Swiss franc. The USD/CHF pair declined and broke the 1.0050 and 1.0000 support levels.
The pair traded as low as 0.9969 and later recovered above 1.0040. However, the upside move was capped by the 1.0070 level and a key bearish trend line with current resistance at 1.0035 on the hourly chart.
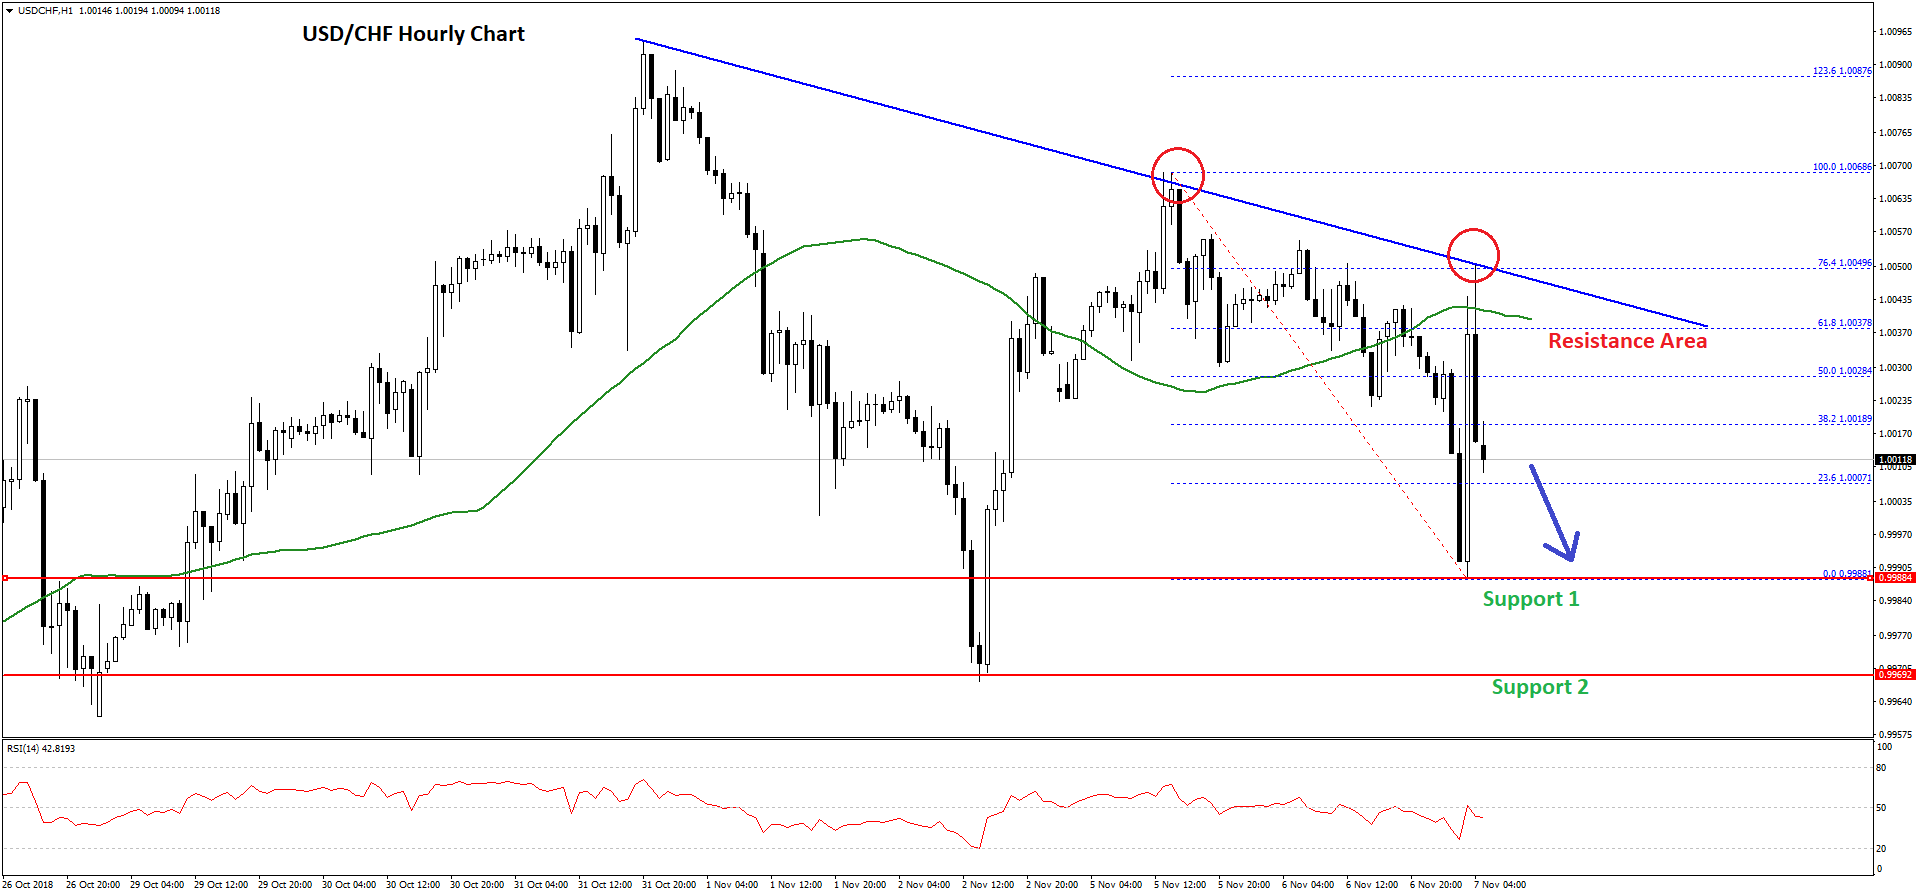
The pair was rejected, resulting in a fresh drop below 1.0020 and the 50 hourly simple moving average. Recently, the pair recovered above the 1.0010 level and the 50% Fib retracement level of the last decline from the 1.0068 high to 0.9988 low.
However, the same bearish trend line prevented gains along with the 50 hourly SMA. Besides, the 76.4% Fib retracement level of the last decline from the 1.0068 high to 0.9988 low also acted as a hurdle for buyers.
The pair is currently declining and it is trading near the 1.0000 support. It seems like sellers are in control and the pair may continue to move down towards the 0.9990 or 0.9970 support level.
On the other hand, if there is an upside correction, the pair could find a solid resistance near 1.0035 and the 50 hourly SMA. To move into a bullish zone, buyers need to push the pair above the 1.0050 resistance zone in the near term.
Trade over 50 forex markets 24 hours a day with FXOpen. Take advantage of low commissions, deep liquidity, and spreads from 0.0 pips (additional fees may apply). Open your FXOpen account now or learn more about trading forex with FXOpen.
This article represents the opinion of the Companies operating under the FXOpen brand only. It is not to be construed as an offer, solicitation, or recommendation with respect to products and services provided by the Companies operating under the FXOpen brand, nor is it to be considered financial advice.
Stay ahead of the market!
Subscribe now to our mailing list and receive the latest market news and insights delivered directly to your inbox.


Latest articles

US Dollar Index: A Defining Week for the King of the Markets
The dollar heads into a pivotal week trading near 101.80, just off a 15-month high, with the Fed's July 29 meeting standing as the clear focal point. Markets currently price roughly a 65% chance of a hold, though renewed

NZD/USD: Inflation Surge Meets Strong US Dollar Pressure
On 21 July, Stats NZ reported an acceleration in inflation: the Consumer Price Index rose 1.5% in the second quarter, while the annual inflation rate climbed to 4.1%, its highest level in more than two years and slightly

Weekly Market Insights with Gary Thomson: The Week of Central Banks and Earnings
In this video, we’ll explore the key economic events and market trends, shaping the financial landscape. Get ready for insights into financial markets to help you navigate the week ahead. Let’s dive in!
In this episode of Market