


EUR/USD Eyes Fresh Increase While USD/CHF Corrects Lower
FXOpen
EUR/USD is eyeing a fresh increase above the 1.0320 resistance zone. USD/CHF is correcting gains and might test the 0.9475 support zone.
Important Takeaways for EUR/USD and USD/CHF
· The Euro started a fresh decline and tested the 1.0220 support against the US Dollar.
· There is a major bearish trend line forming with resistance near 1.0315 on the hourly chart of EUR/USD.
· USD/CHF started a fresh increase after it was able to clear the 0.9500 resistance.
· There was a break below a key bullish trend line with support near 0.9540 on the hourly chart.
EUR/USD Technical Analysis
This week, the Euro started a downside correction from the 1.0400 zone against the US Dollar. The EUR/USD pair declined below the 1.0320 support level to move into a short-term bearish zone.
The pair even tested the 1.0220 support zone. It traded as low as 1.0222 on FXOpen and recently started a decent increase. There was a move above the 1.0275 level and the 50 hourly simple moving average. The pair even cleared the 50% Fib retracement level of the downward move from the 1.0395 swing high to 1.0222 low.
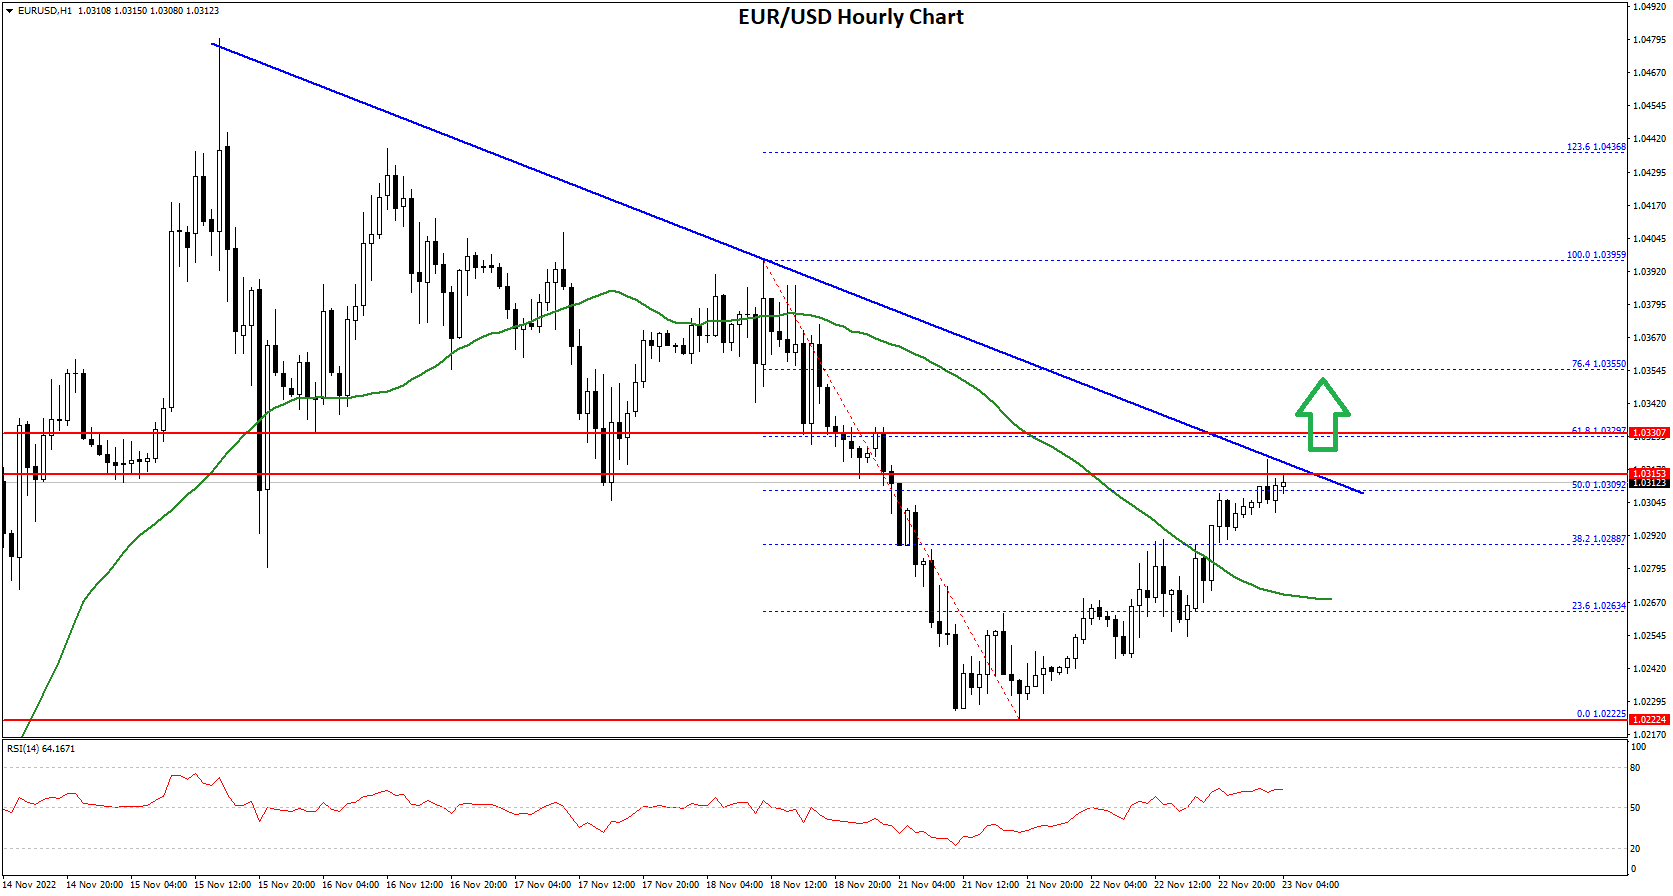
An immediate resistance is near the 1.0320 level. There is also a major bearish trend line forming with resistance near 1.0315 on the hourly chart of EUR/USD.
The 61.8% Fib retracement level of the downward move from the 1.0395 swing high to 1.0222 low is also near 1.0329 to act as resistance. The next major resistance is near the 1.0350 level. A clear move above the 1.0350 resistance zone could set the pace for a larger increase towards 1.0400.
The next major resistance is near the 1.0500 zone. On the downside, an immediate support is near the 1.0280 level. The next major support is near the 1.0265 level. A downside break below the 1.0265 support could start another decline.
USD/CHF Technical Analysis
The US Dollar formed a support base near the 0.9350 and started a fresh increase against the Swiss franc. The USD/CHF pair traded above the 0.9500 level to move into a positive zone.
The pair even climbed above the 0.9550 level and the 50 hourly simple moving average. The pair climbed as high as 0.9599 before there was a downside correction. There was a move below the 0.9550 level and the 50 hourly simple moving average.
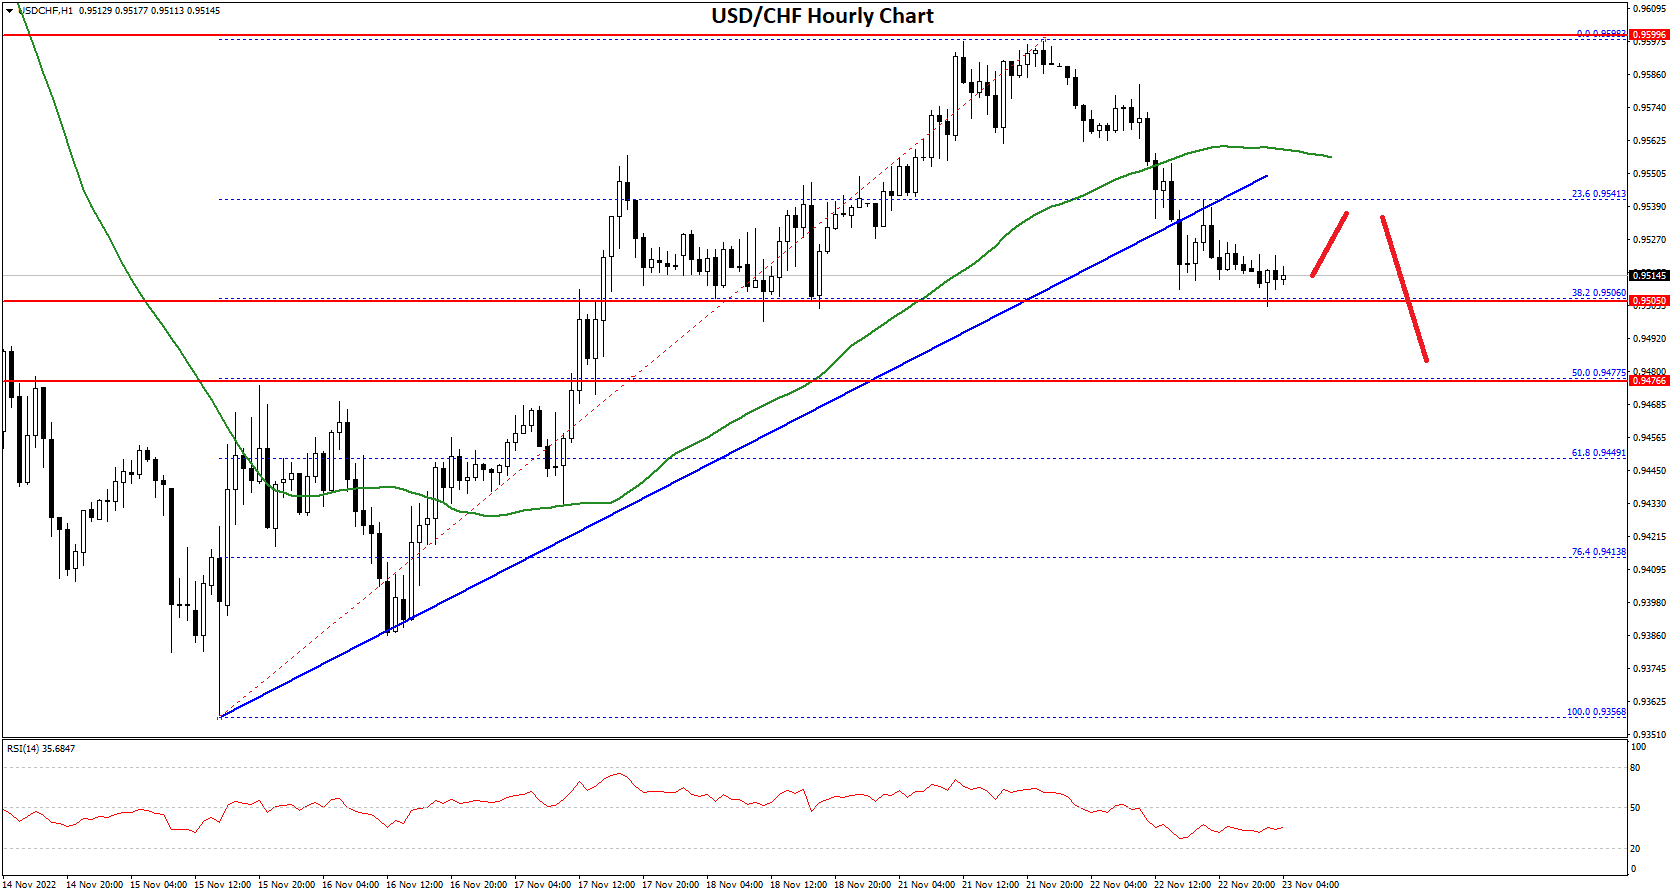
Besides, there was a break below a key bullish trend line with support near 0.9540 on the hourly chart. There was a move below the 23.6% Fib retracement level of the upward move from the 0.9356 swing low to 0.9599 high.
On the downside, an immediate support is near the 0.9475 level. It is near the 50% was a break below a key bullish trend line with support near 0.9540 on the hourly chart.
Any more losses may possibly open the doors for a move towards the 0.9420 level. If not, the pair might rise again. An immediate resistance is near the 0.9550 level. The next major resistance is near the 0.9600 level.
If there is a clear break above the 0.9600 resistance zone, the pair could start another increase. In the stated case, it could test 0.9680.
This forecast represents FXOpen Companies opinion only, it should not be construed as an offer, invitation or recommendation in respect to FXOpen Companies products and services or as financial advice.
Trade over 50 forex markets 24 hours a day with FXOpen. Take advantage of low commissions, deep liquidity, and spreads from 0.0 pips (additional fees may apply). Open your FXOpen account now or learn more about trading forex with FXOpen.
This article represents the opinion of the Companies operating under the FXOpen brand only. It is not to be construed as an offer, solicitation, or recommendation with respect to products and services provided by the Companies operating under the FXOpen brand, nor is it to be considered financial advice.
Stay ahead of the market!
Subscribe now to our mailing list and receive the latest market news and insights delivered directly to your inbox.


Latest articles

AI Valuations Are Back in the Spotlight
Artificial intelligence remains the dominant investment theme of 2026, but investors are increasingly questioning whether AI stock valuations are keeping pace with reality.
💰 Big Tech continues to invest at an unprecedented scale, with hyperscaler AI spending projected to exceed $800

AUD/CAD: Months of Indecision — Is a Breakout Finally Coming?
The Australian dollar has clawed back most of its end-of-June losses, when it touched three-month lows against the greenback amid escalating Middle East tensions. Since then, sentiment has improved: the RBA's Assistant Governor Sarah Hunter signalled the board stands ready

USD/JPY: Battling at the Top of the Triangle
On 3 July, Japan's Finance Minister, Satsuki Katayama, stated that the Ministry of Finance remains in close contact with US authorities regarding developments in USD/JPY as the yen traded near its weakest level in almost 40 years. Similar verbal