


EUR/USD Gathers Pace, USD/JPY Dips Below 150
FXOpen
EUR/USD started a steady increase above the 0.9900 resistance zone. USD/JPY started a downside correction from the 152.00 resistance zone.
Important Takeaways for EUR/USD and USD/JPY
· The Euro formed a base and started a decent upward move above the 0.9850 zone.
· There is a major bullish trend line forming with support near 0.9910 on the hourly chart of EUR/USD.
· USD/JPY declined sharply after it surged to a new multi-year high at 151.94.
· There was a break below a key bullish trend line with support near 150.40 on the hourly chart.
EUR/USD Technical Analysis
This past week, the Euro found support near the 0.9700 zone against the US Dollar. The EUR/USD pair started a steady upward move above the 0.9800 and 0.9820 resistance levels.
There was a key increase above the 0.9900 resistance zone and the 50 hourly simple moving average. The pair even climbed above the 0.9950 resistance zone. A high was formed near 0.9977 on FXOpen and the pair is now consolidating gains.
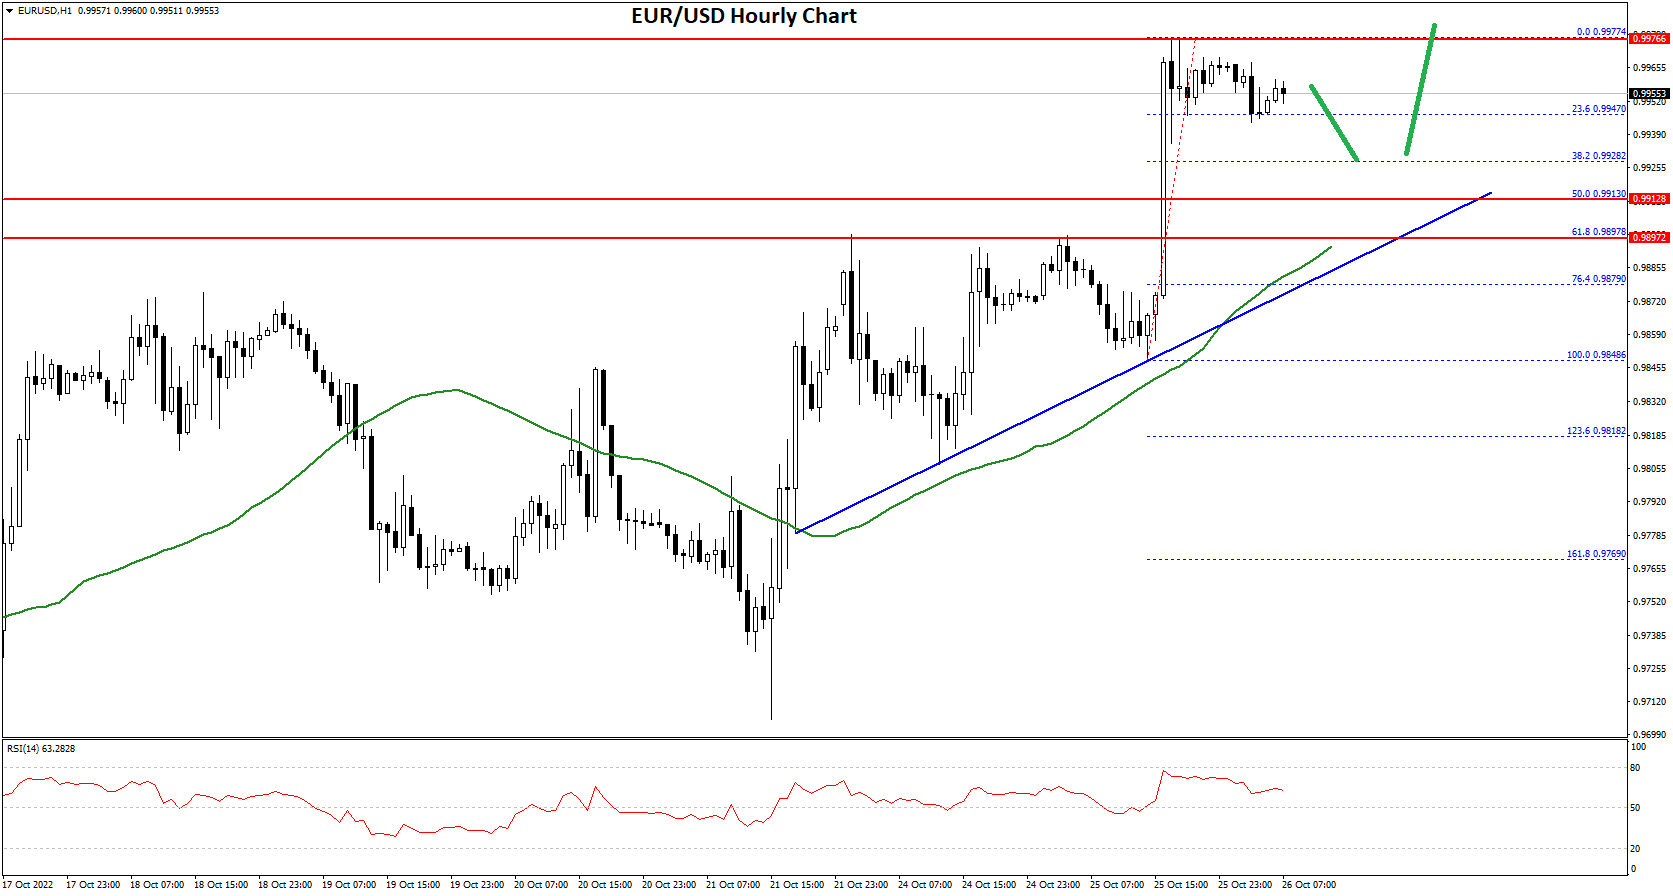
An initial support on the downside is near the 0.9950 level. It is near the 23.6% Fib retracement level of the upward move from the 0.9848 swing low to 0.9977 high.
The first major support is near the 0.9920 level. There is also a major bullish trend line forming with support near 0.9910 on the hourly chart of EUR/USD. The main support sits near the 0.9910 zone. It is near the 50% Fib retracement level of the upward move from the 0.9848 swing low to 0.9977 high.
An immediate resistance on the upside is near the 0.9980 level. The next major resistance is near the 1.0000 level. An upside break above 1.0000 could set the pace for another increase. In the stated case, the pair might revisit 1.0120. Any more gains might send the pair towards 1.0200.
USD/JPY Technical Analysis
The US Dollar started a fresh decline from well above the 151.00 zone against the Japanese Yen. The USD/JPY pair declined below the 150.50 and 150.00 levels.
Besides, there was a break below a key bullish trend line with support near 150.40 on the hourly chart. There was a drop below the 150.00 level and the 50 hourly simple moving average. The bears even pushed the pair below the 148.00 level.
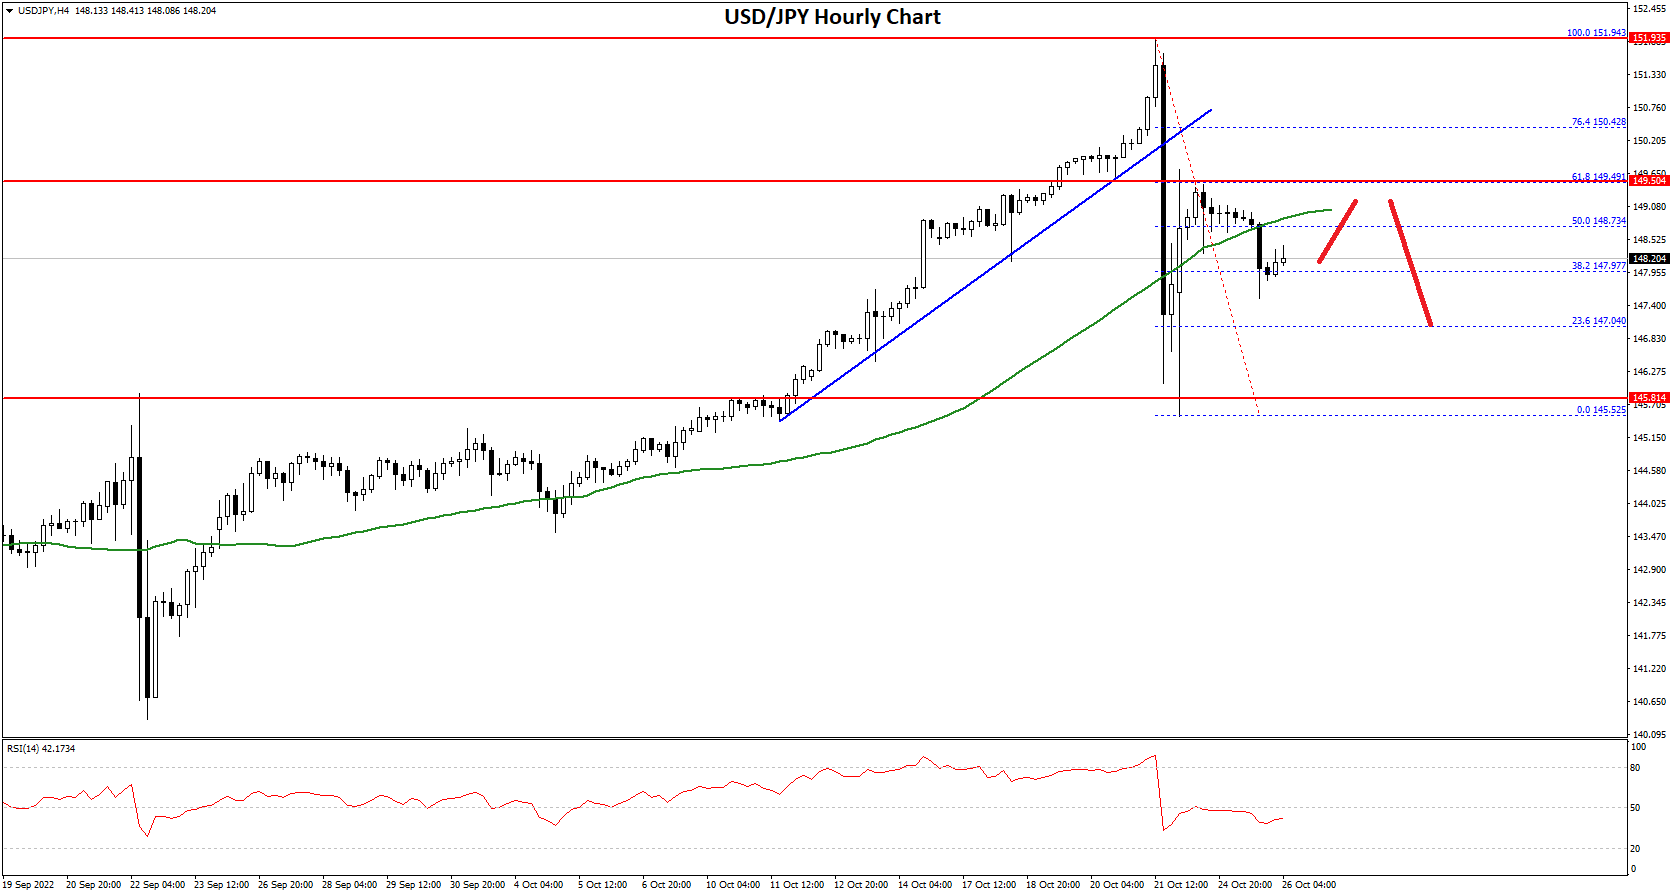
It tested the 145.50 zone. A low is formed near 145.52 and the pair is now correcting higher. There was a move above the 147.00 level. The pair climbed above the 50% Fib retracement level of the downside correction from the 151.94 swing high to 145.52 low.
However, the pair failed to clear the 149.50 resistance. It is near the 61.8% Fib retracement level of the downside correction from the 151.94 swing high to 145.52 low.
The next major resistance is near the 150.00 level. Any more gains could send the pair towards the 150.50 level. The next key hurdle is near the 152.00 level.
An initial support on the downside is near the 147.40 level. The next major support is near the 146.20 level. Any more downsides might lead the pair towards the 145.50 support zone, below which the bears might aim a test of the 143.20 support zone.
This forecast represents FXOpen Companies opinion only, it should not be construed as an offer, invitation or recommendation in respect to FXOpen Companies products and services or as financial advice.
This article represents the opinion of the Companies operating under the FXOpen brand only. It is not to be construed as an offer, solicitation, or recommendation with respect to products and services provided by the Companies operating under the FXOpen brand, nor is it to be considered financial advice.
Stay ahead of the market!
Subscribe now to our mailing list and receive the latest market news and insights delivered directly to your inbox.

Latest articles

AI Valuations Are Back in the Spotlight
Artificial intelligence remains the dominant investment theme of 2026, but investors are increasingly questioning whether AI stock valuations are keeping pace with reality.
💰 Big Tech continues to invest at an unprecedented scale, with hyperscaler AI spending projected to exceed $800

AUD/CAD: Months of Indecision — Is a Breakout Finally Coming?
The Australian dollar has clawed back most of its end-of-June losses, when it touched three-month lows against the greenback amid escalating Middle East tensions. Since then, sentiment has improved: the RBA's Assistant Governor Sarah Hunter signalled the board stands ready

USD/JPY: Battling at the Top of the Triangle
On 3 July, Japan's Finance Minister, Satsuki Katayama, stated that the Ministry of Finance remains in close contact with US authorities regarding developments in USD/JPY as the yen traded near its weakest level in almost 40 years. Similar verbal