


FXOpen

EUR/USD started a strong upward move above the 1.1020 resistance area and extended gains after the fed rate cut. Conversely, USD/CHF is under pressure and it is likely to extend losses below 0.9550.
Important Takeaways for EUR/USD and USD/CHF
- The Euro is following a strong bullish path above the 1.1000 and 1.1020 levels against the US Dollar.
- There is a major bullish trend line forming with support near 1.1100 on the hourly chart of EUR/USD.
- USD/CHF is gaining momentum below the 0.9600 support level.
- There is a key declining channel forming with resistance near 0.9580 on the hourly chart.
EUR/USD Technical Analysis
In the past few days, the Euro started a strong increase above the 1.0920 resistance area against the US Dollar. The EUR/USD pair broke a few important hurdles near the 1.1000 and 1.1020 levels to enter a positive zone.
Moreover, there was a close above the 1.1100 barrier and the 50 hourly simple moving average. The pair traded as high as 1.1211 on FXOpen and it is currently consolidating gains.
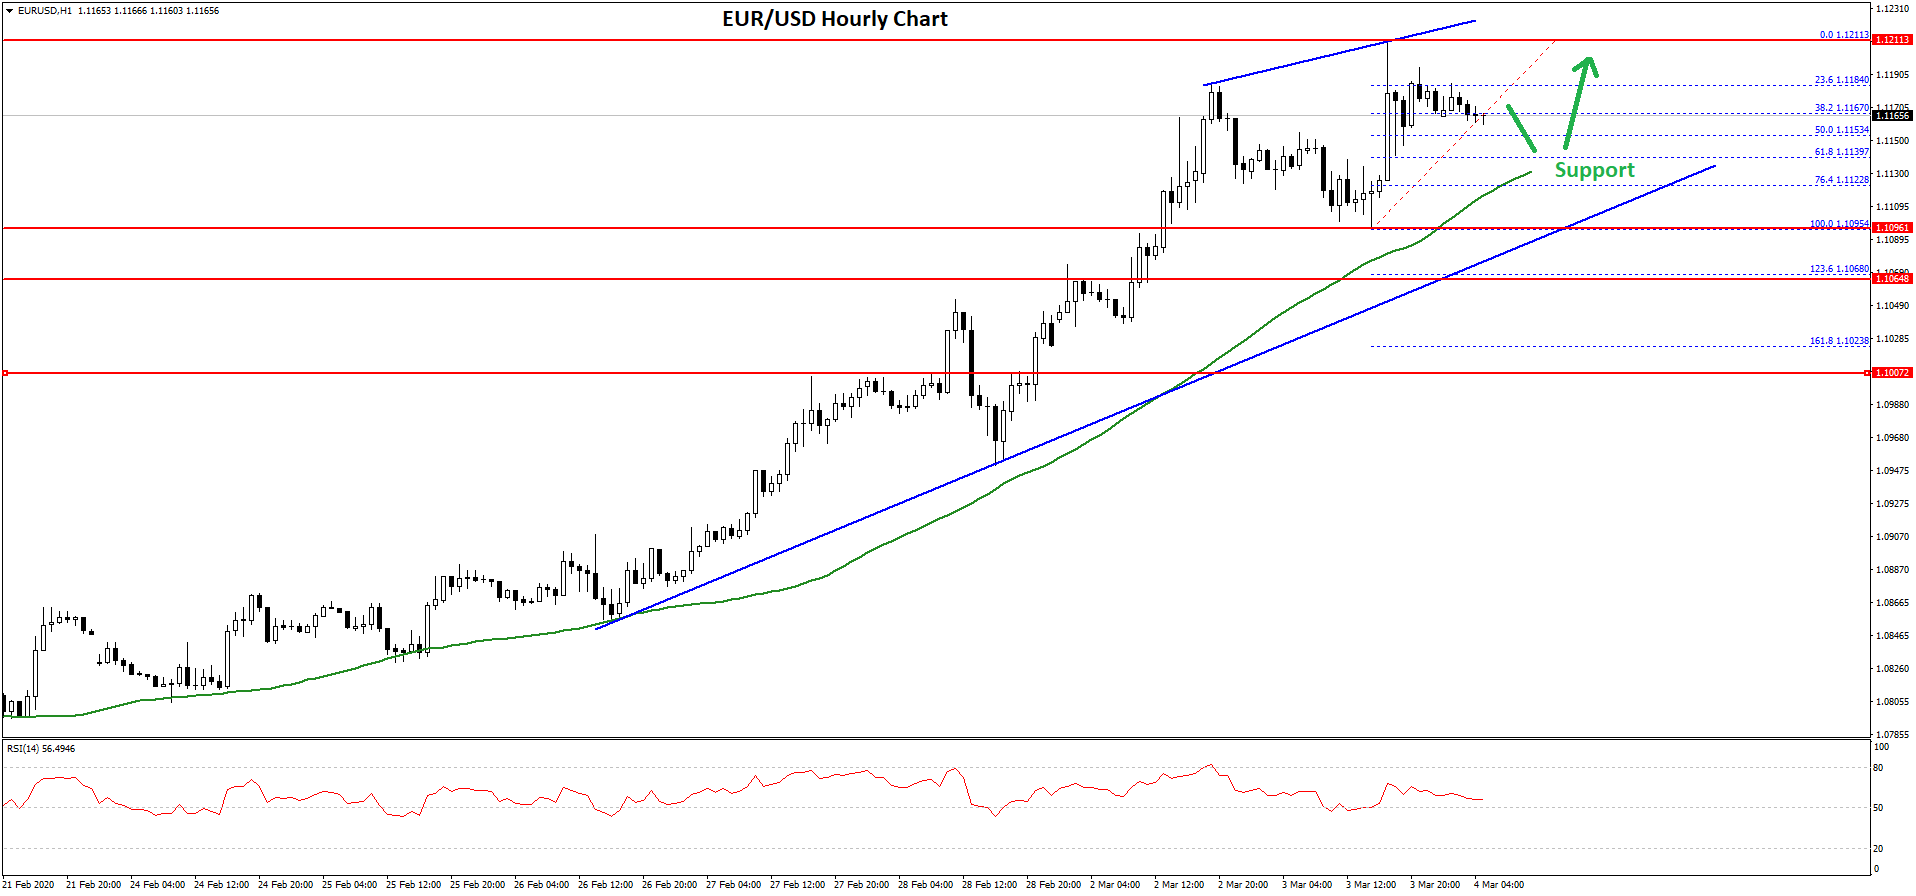
It is trading below the 23.6% Fib retracement level of the upward move from the 1.1095 low to 1.1211 high. An initial support is seen near the 1.1150 level.
Besides, the 50% Fib retracement level of the upward move from the 1.1095 low to 1.1211 high is also near the 1.1153 level. More importantly, there is a major bullish trend line forming with support near 1.1100 on the hourly chart of EUR/USD.
Therefore, there are many key supports on the downside, starting with 1.1150 and ending up to 1.1100. Any further losses may perhaps lead the pair towards the 1.1060 support area.
On the upside, the main hurdle for the bulls is near the 1.1200 and 1.1210 levels. A clear break above the 1.1200 resistance area could open the doors for a larger upward move towards 1.1250 and 1.1260 in the near term.
USD/CHF Technical Analysis
The US Dollar started a major decline from well above the 0.9700 level against the Swiss franc. The USD/CHF pair broke many important supports near the 0.9650 level to enter a bearish zone.
The decline was such that the pair settled below the 0.9600 support level and the 50 hourly simple moving average. Finally, the pair spiked below the 0.9550 support level and a new weekly low is formed near the 0.9515 level.
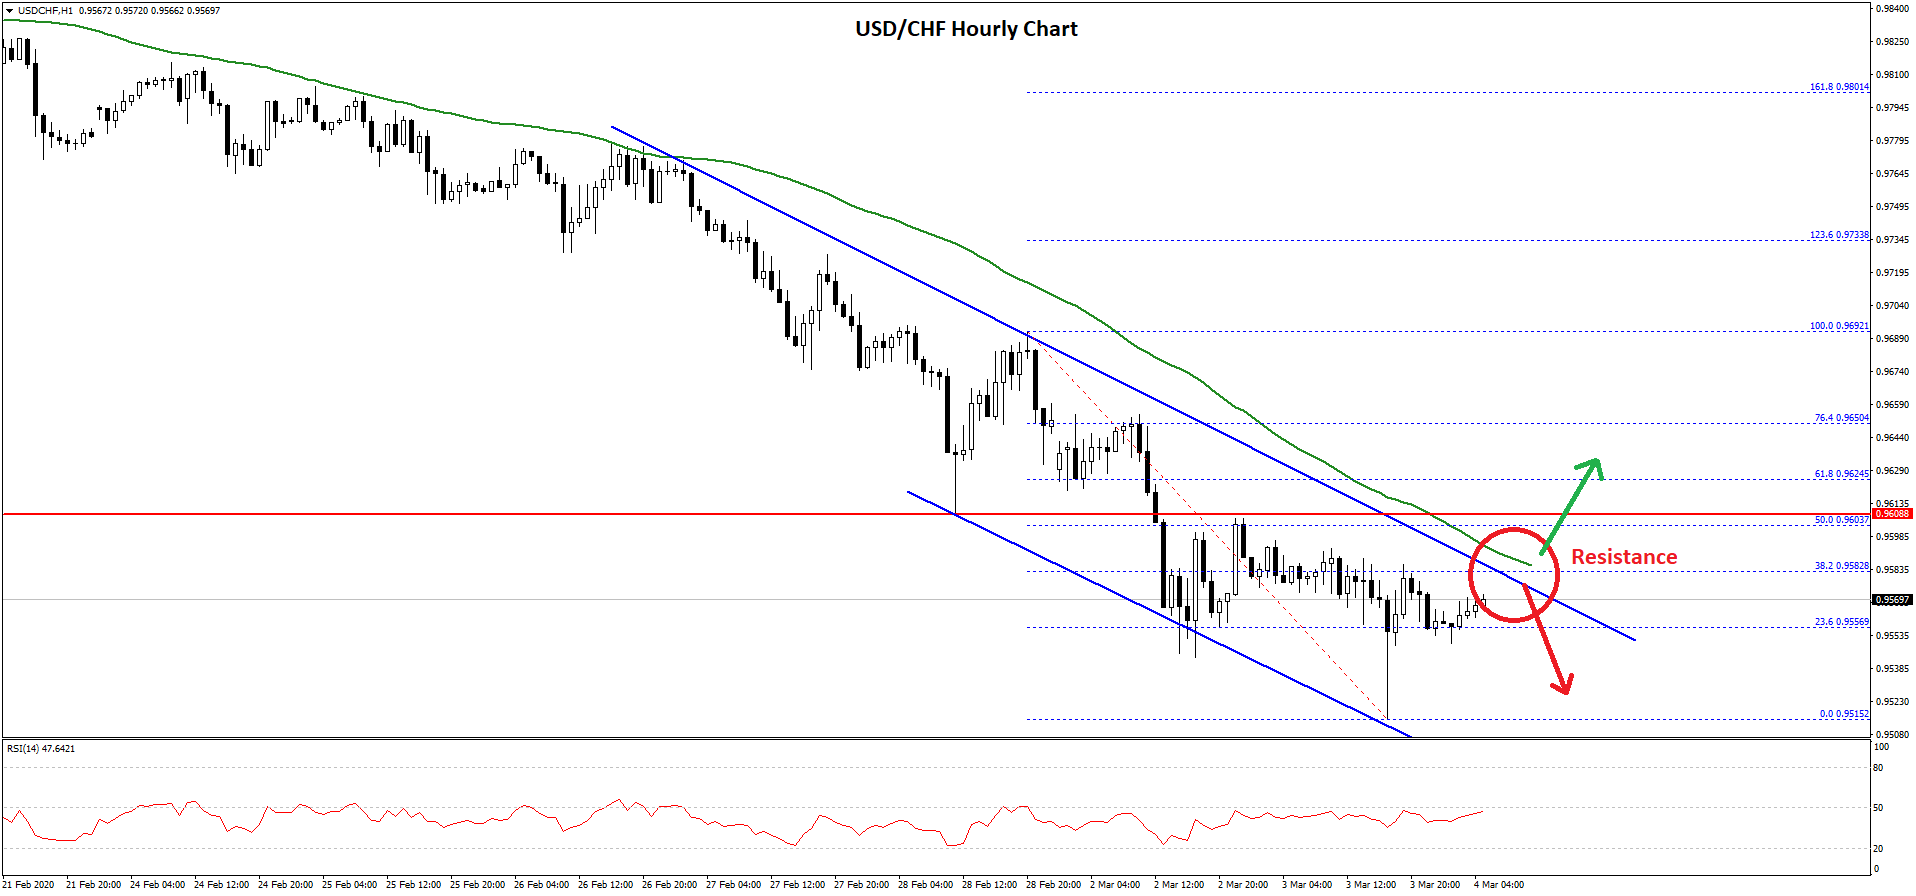
The pair is currently correcting higher and trading above the 0.9550 level. It surpassed the 23.6% Fib retracement level of the recent decline from the 0.9692 high to 0.9515 low.
However, there are many hurdles on the upside near the 0.9590 and 0.9600 levels. Additionally, there is a key declining channel forming with resistance near 0.9580 on the hourly chart.
The 50% Fib retracement level of the recent decline from the 0.9692 high to 0.9515 low is also near the 0.9600 area. Therefore, an upside break above the 0.9600 resistance area could open the doors for a larger upward move in the coming sessions.
On the downside, an initial support is near the 0.9520 level. If there is a bearish break below the 0.9520 support, there is a risk of a sharp decline below 0.9500 and 0.9480.
Trade over 50 forex markets 24 hours a day with FXOpen. Take advantage of low commissions, deep liquidity, and spreads from 0.0 pips. Open your FXOpen account now or learn more about trading forex with FXOpen.
This article represents the opinion of the Companies operating under the FXOpen brand only. It is not to be construed as an offer, solicitation, or recommendation with respect to products and services provided by the Companies operating under the FXOpen brand, nor is it to be considered financial advice.
Stay ahead of the market!
Subscribe now to our mailing list and receive the latest market news and insights delivered directly to your inbox.

Latest from Forex Analysis
Latest articles

Weekly Market Wrap With Gary Thomson: Nasdaq, EUR/USD, USD/CHF, Brent Crude Oil, Googl Shares
Get the latest scoop on the week's hottest headlines, all in one convenient video. Join Gary Thomson, the COO of FXOpen UK, as he breaks down the most significant news reports and shares his expert insights.
- Nasdaq Composite: Worst Session

Analysis of AUD/USD: Exchange Rate Falls to Early May Low
As indicated by the 4-hour AUD/USD chart today:
→ the rate fell below 0.652, a level last seen on May 2;
→ the RSI indicator dropped below 15, a level last seen during the panic over the spread of COVID-19

Analysis of AMZN Stock: Price at 1.5-Month Low
As shown in the AMZN chart, the stock price dropped below:
→ the psychological level of $180;
→ the mid-June interim low.
The last time AMZN traded below $180 was in early June.
Thus, AMZN has faced sell-offs, similar to other tech