


EUR/USD Rebounds Sharply While USD/CHF Tumbled Below 0.9880
FXOpen
EUR/USD formed support base at 1.1380 and rebounded sharply. On the other hand, USD/CHF declined heavily and traded below the 0.9900 and 0.9880 support levels.
Important Takeaways for EUR/USD and USD/CHF
- The Euro started a solid rise from the 1.1350 swing low against the US Dollar.
- There is a major bullish trend line in place with support at 1.1560 on the hourly chart of EUR/USD.
- USD/CHF tumbled and broke the 0.9900 and 0.9880 support levels.
- The pair may perhaps correct higher, but upsides are likely to be capped near 0.9870/80.
EUR/USD Technical Analysis
After a major decline, the Euro found support near the 1.1320 and 1.1350 levels against the US Dollar. The EUR/USD pair formed a base and rallied above the 1.1400 and 1.1500 resistance levels.
The upside move was strong since the pair closed above the 1.1520 and 1.1540 resistance levels plus the 50 hourly simple moving average. It cleared the path for more gains and the pair spiked towards the 1.1600 level.
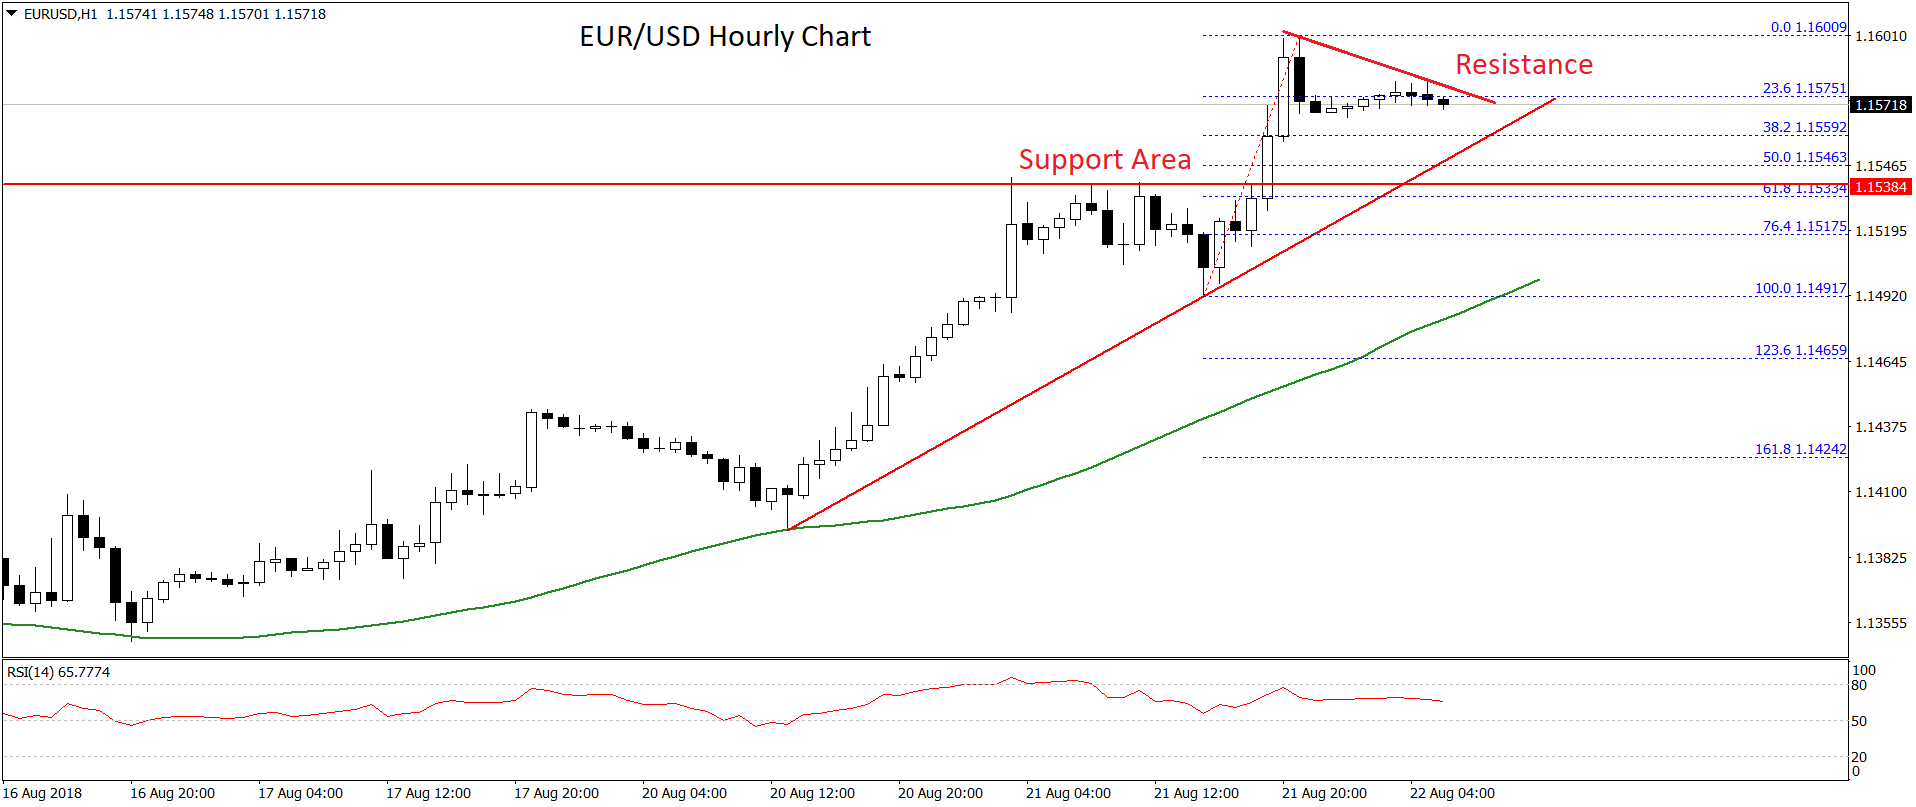
Later, the pair started a downside correction and traded below the 1.1580 level. There was a break below the 23.6% Fib retracement level of the last wave from the 1.1491 low to 1.1600 high.
However, there are many supports on the downside near the 1.1550 level. There is also a major bullish trend line in place with support at 1.1560 on the hourly chart of EUR/USD. If the price breaks the trend line support, it could test the 1.1540 support and the 50% Fib retracement level of the last wave from the 1.1491 low to 1.1600 high.
The next major support is near the 1.1500 level and 50 hourly SMA, which is also a key pivot zone. On the upside, an initial resistance is near the 1.1600 level, above which, the Euro could accelerate gains above the 1.1620 and 1.1630 levels.
Overall, the current price structure is positive as long as the pair is above the 1.1540 and 1.1550 support levels.
USD/CHF Technical Analysis
The US Dollar failed to clear the 0.9970 and 0.9980 resistance levels against the Swiss franc. The USD/CHF pair started a downside move and broke the 0.9950 support area.
More importantly, there was a break below a bullish trend line with support at 0.9935 on the hourly chart of USD/CHF. As a result, there was a sharp downside move and the pair broke the 0.9900 support and the 50 hourly SMA.
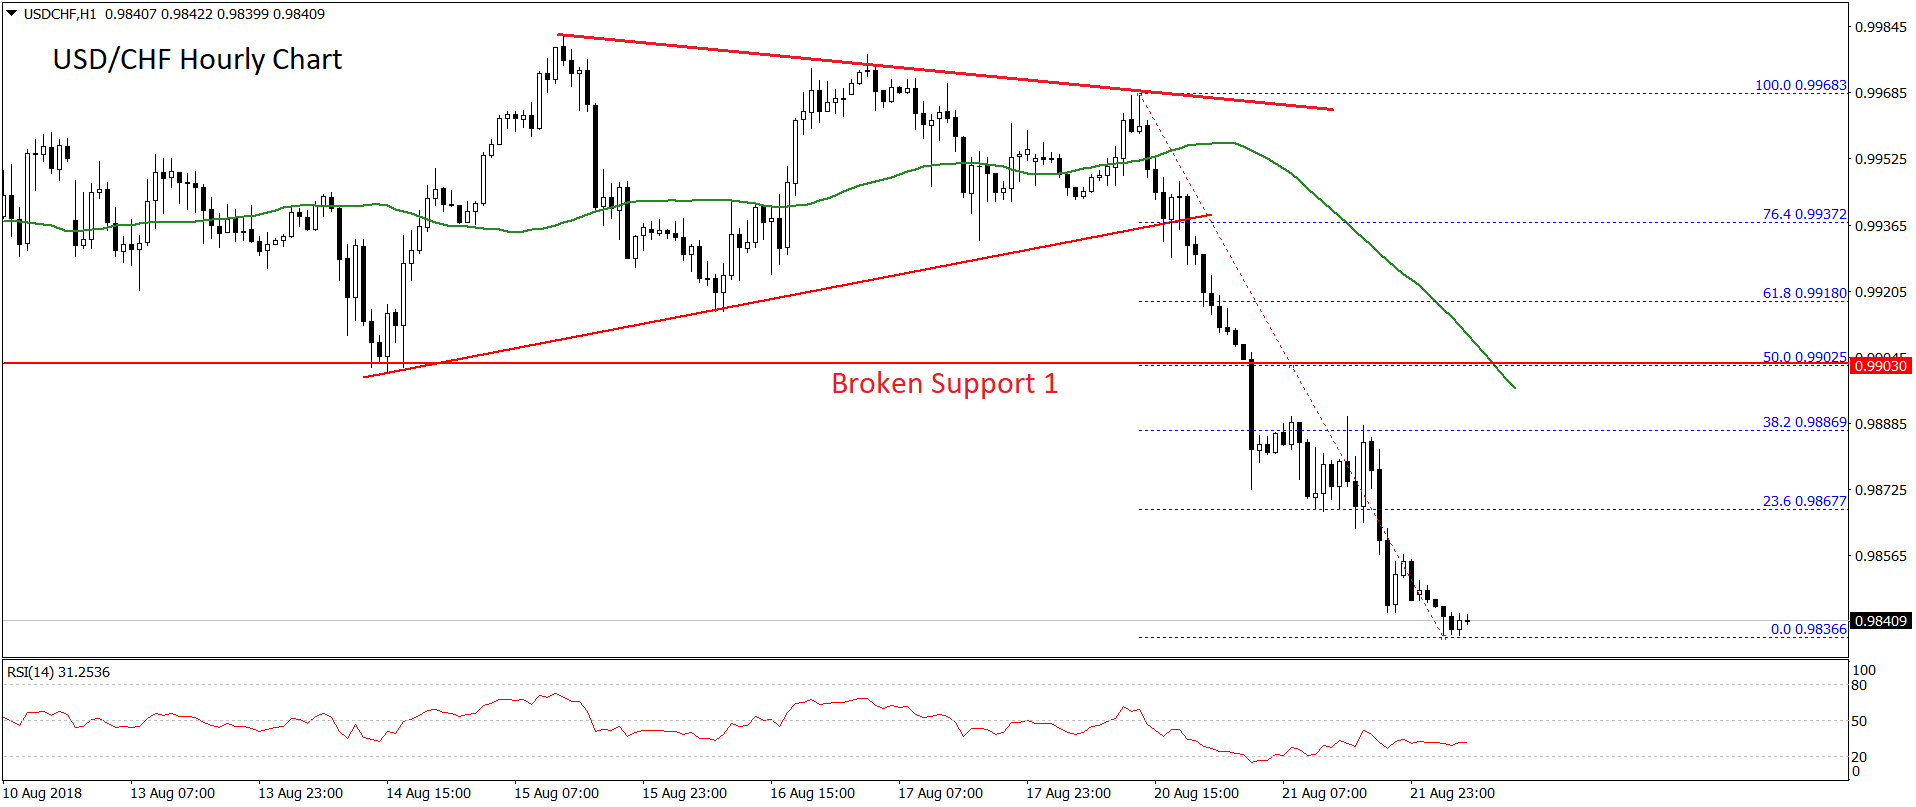
The pair traded as low as 0.9836 and it is currently consolidating losses. If the pair corrects higher, an initial resistance is near the 23.6% Fib retracement level of the last drop from the 0.9968 high to 0.9836 low.
If there is a break above the 0.9860 and 0.9870 resistance levels, the pair may continue to trade higher towards the 0.9900 resistance. It is a major hurdle for buyers and it represents the 50% Fib retracement level of the last drop from the 0.9968 high to 0.9836 low.
On the flip side, if the pair breaks the 0.9835 low, it could decline sharply in the near term. The next major support on the downside is at 0.9800, below which, the pair may well trade towards the 0.9750 level in the near term.
Trade over 50 forex markets 24 hours a day with FXOpen. Take advantage of low commissions, deep liquidity, and spreads from 0.0 pips (additional fees may apply). Open your FXOpen account now or learn more about trading forex with FXOpen.
This article represents the opinion of the Companies operating under the FXOpen brand only. It is not to be construed as an offer, solicitation, or recommendation with respect to products and services provided by the Companies operating under the FXOpen brand, nor is it to be considered financial advice.
Stay ahead of the market!
Subscribe now to our mailing list and receive the latest market news and insights delivered directly to your inbox.


Latest articles

Apple: Earnings Day Above the Activity Zone
On 30 April, after the market close, Apple Inc. will release its financial results for the second quarter of fiscal 2026. The consensus forecast, based on estimates from 31 analysts, points to revenue of around $109.7 billion, with expected

USD/JPY and USD/CHF Near Key Levels: The Dollar Supported by the Fed
The US dollar continues to trend upwards following the Federal Reserve meeting, drawing support from the regulator’s moderately hawkish stance and comments by Jerome Powell. Markets interpret the Fed’s rhetoric as a signal that restrictive policy is likely

EUR/USD and GBP/USD consolidate ahead of the Fed decision
European currencies are showing subdued dynamics, entering a consolidation phase following their previous advance. Earlier, EUR/USD and GBP/USD broke out of their ranges and strengthened; however, the subsequent correction has led both pairs to retest the previously breached