


EUR/USD Recovering Losses, USD/JPY Remains At Risk
FXOpen

EUR/USD started a downside correction from well above 1.2300 and recently found support near 1.2055. USD/JPY is showing bearish signs and it could decline heavily below 103.50.
Important Takeaways for EUR/USD and USD/JPY
- The Euro remained well bid above 1.2050 and started a fresh increase.
- There was a break above a major bearish trend line with resistance near 1.2120 on the hourly chart of EUR/USD.
- USD/JPY is declining and showing bearish signs below the 104.00 resistance.
- There is a key bearish trend line forming with resistance near 103.98 on the hourly chart.
EUR/USD Technical Analysis
In the past few days, there was a steady decline in the Euro from well above 1.2200 against the US Dollar. The EUR/USD pair even broke the 1.2120 support level, but it remained well bid above 1.2050.
A low was formed near 1.2053 on FXOpen before the pair is currently recovering losses. There was a break above the 1.2100 resistance level and the 50 hourly simple moving average, opening the doors for a steady increase.
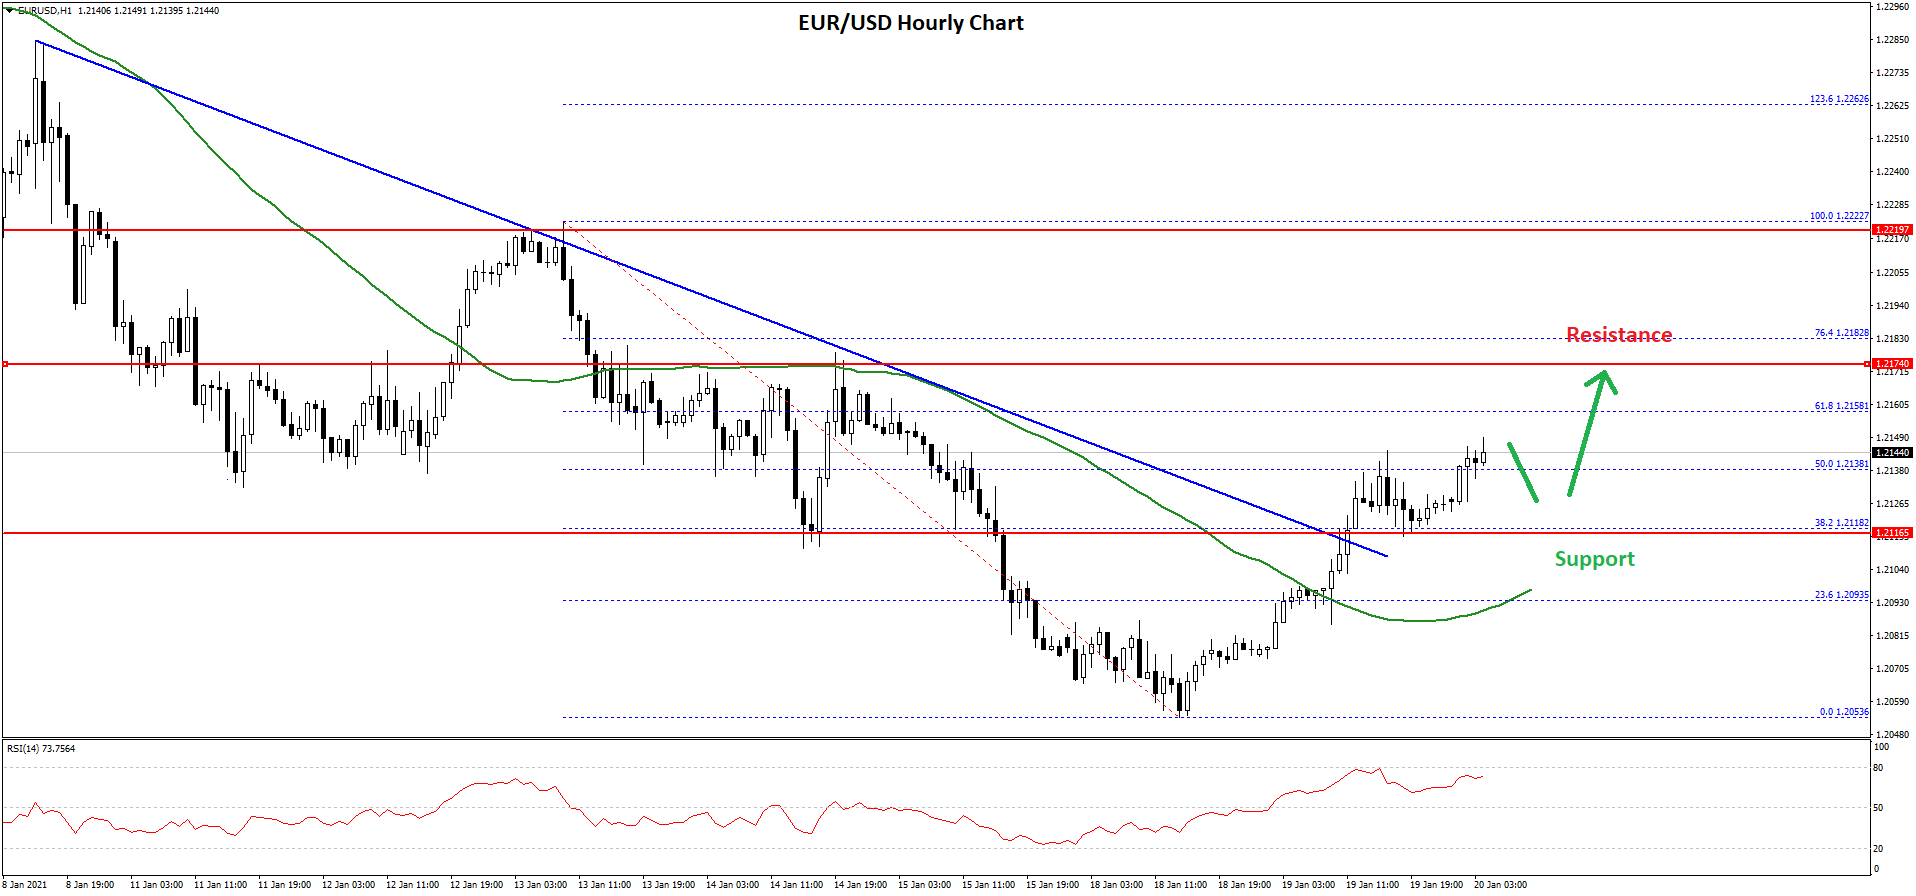
There was also a break above a major bearish trend line with resistance near 1.2120 on the hourly chart of EUR/USD. The pair even broke the 50% Fib retracement level of the downward move from the 1.2222 swing high to 1.2053 low.
An immediate resistance is near the 1.2058 level. It is close to the 61.8% Fib retracement level of the downward move from the 1.2222 swing high to 1.2053 low. The main resistance is near the 1.2175, above which EUR/USD is likely to accelerate higher.
Conversely, the pair could start a fresh decline below the 1.2135 support. The first major support is near the 1.2115 zone. If there is a downside break below the 1.2115 support zone, the pair could continue to move down. In the stated case, there are high chances of a retest of the 1.2053 swing low in the near term.
USD/JPY Technical Analysis
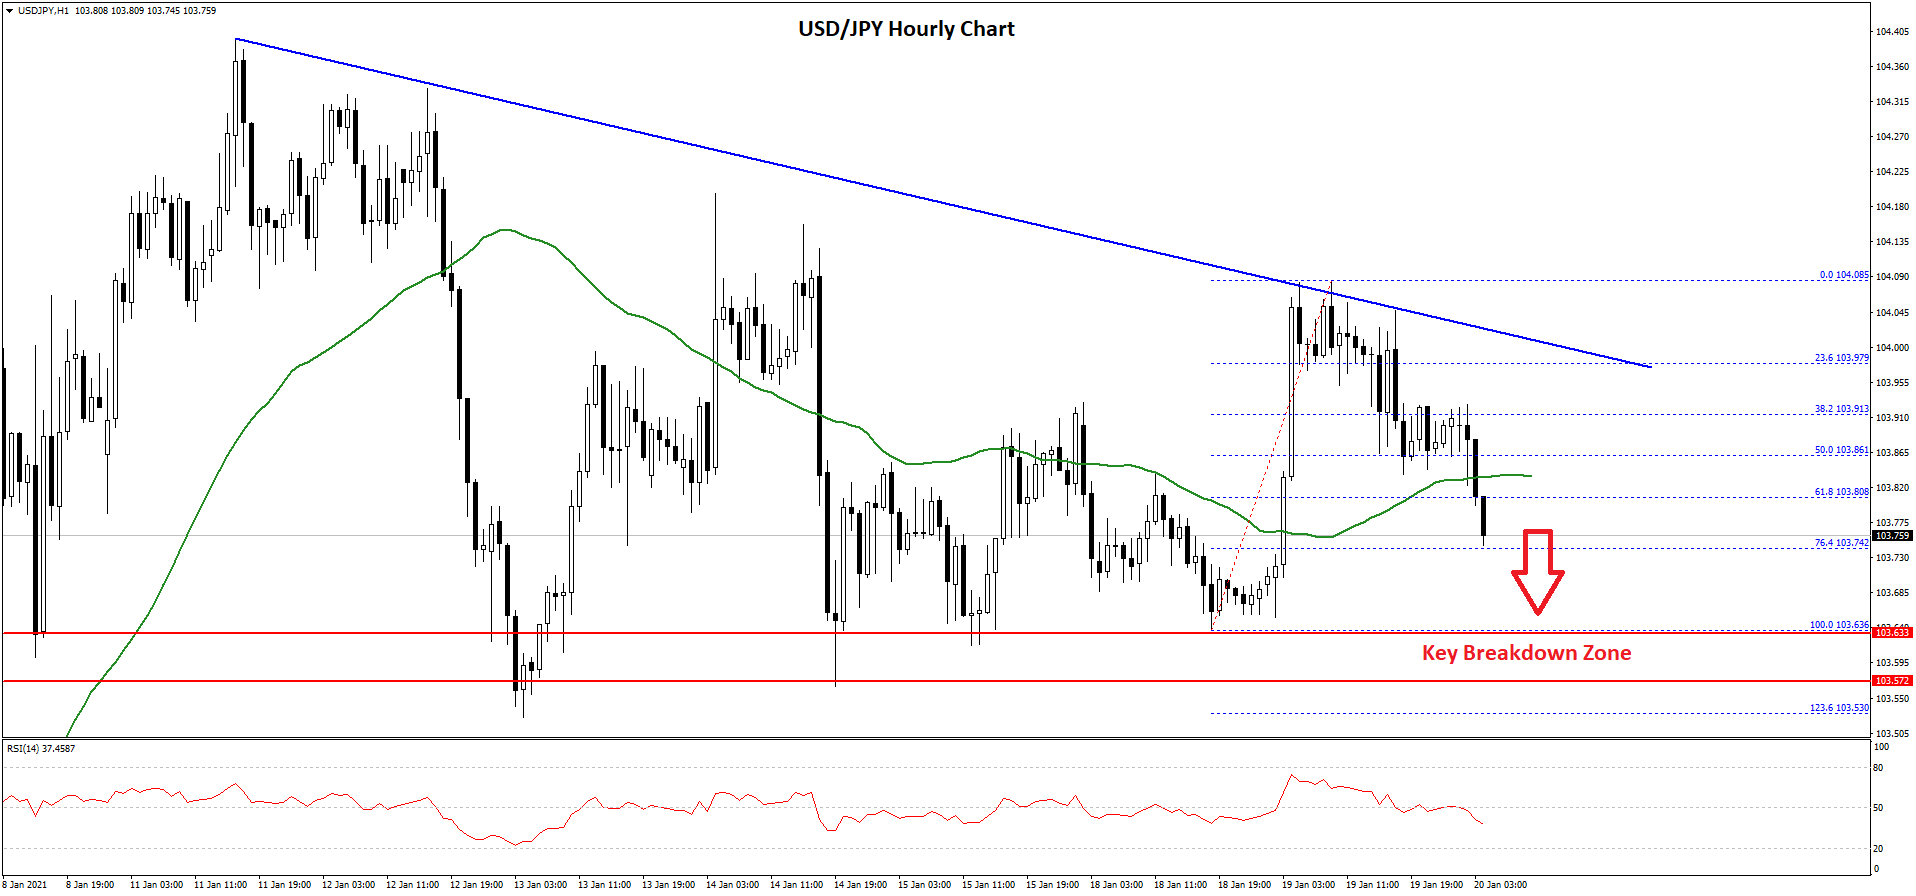
The US Dollar seems to be trading in a broad range below the 104.20 and 104.50 resistance levels against the Japanese Yen. The USD/JPY pair formed a high near 104.08, and recently started a fresh decline.
There was a break below the 103.85 support level the 50 hourly simple moving average. The pair also declined below the 50% Fib retracement level of the upward move from the 103.63 low to 104.08 high.
 ur
ur
It is now trading near a key support at 103.75. It is close to the 76.4% Fib retracement level of the upward move from the 103.63 low to 104.08 high. If there is a downside break below the 103.75 level, the pair could move towards the main 103.50 support zone.
The stated 103.50 support holds the key, below which the pair could decline heavily in the near term. On the upside, the first major resistance is near the 103.85 level.
There is also a key bearish trend line forming with resistance near 103.98 on the hourly chart. A clear break above the trend line is must for a steady increase.
The next key resistance could be near 104.20, above which USD/JPY could revisit 104.50. Any more gains may possibly increase the chances of a test of the 105.00 level in the near term.
Trade over 50 forex markets 24 hours a day with FXOpen. Take advantage of low commissions, deep liquidity, and spreads from 0.0 pips (additional fees may apply). Open your FXOpen account now or learn more about trading forex with FXOpen.
This article represents the opinion of the Companies operating under the FXOpen brand only. It is not to be construed as an offer, solicitation, or recommendation with respect to products and services provided by the Companies operating under the FXOpen brand, nor is it to be considered financial advice.
Stay ahead of the market!
Subscribe now to our mailing list and receive the latest market news and insights delivered directly to your inbox.


Latest articles

FTSE 100: Correction Has Ended, but a New Impulse Has Yet to Form
Fundamental backdrop
The UK inflation report for April, published on 20 May, delivered unexpectedly positive figures: annual inflation slowed to 2.8% in April 2026 from 3.3% in March, coming in below the consensus forecast of 3.0% and

Candlestick Wick Analysis in Trading
Candlestick wicks often contain critical information about buying and selling pressure that body patterns alone may not

Market Structure Shift (MSS) in Trading
A Market Structure Shift (MSS) is an ICT trading concept used to identify potential changes