


EUR/USD Recovering While USD/JPY Tumbling
FXOpen

EUR/USD started a fresh increase and it recently traded above the 1.1035 resistance area. Conversely, USD/JPY is under a lot of selling pressure and it traded below the 109.00 support area.
Important Takeaways for EUR/USD and USD/JPY
- The Euro is showing positive signs above the 1.1035 and 1.1050 resistance levels.
- There is a short term ascending channel forming with support near 1.1075 on the hourly chart of EUR/USD.
- USD/JPY started a major downward move after it failed to surpass the 109.75 resistance area.
- The pair traded below a couple of important bullish trend lines near 109.50 on the hourly chart.
EUR/USD Technical Analysis
The Euro remained well bid above the 1.0980 support area against the US Dollar. As a result, the EUR/USD pair started a fresh increase above the 1.1000 and 1.1020 resistance levels.
During the recovery, the pair broke a major resistance area near the 1.1035 level. Moreover, there was a close above the 1.1050 level and 50 hourly simple moving average. It opened the doors for more gains and the pair traded towards the 1.1090 level.
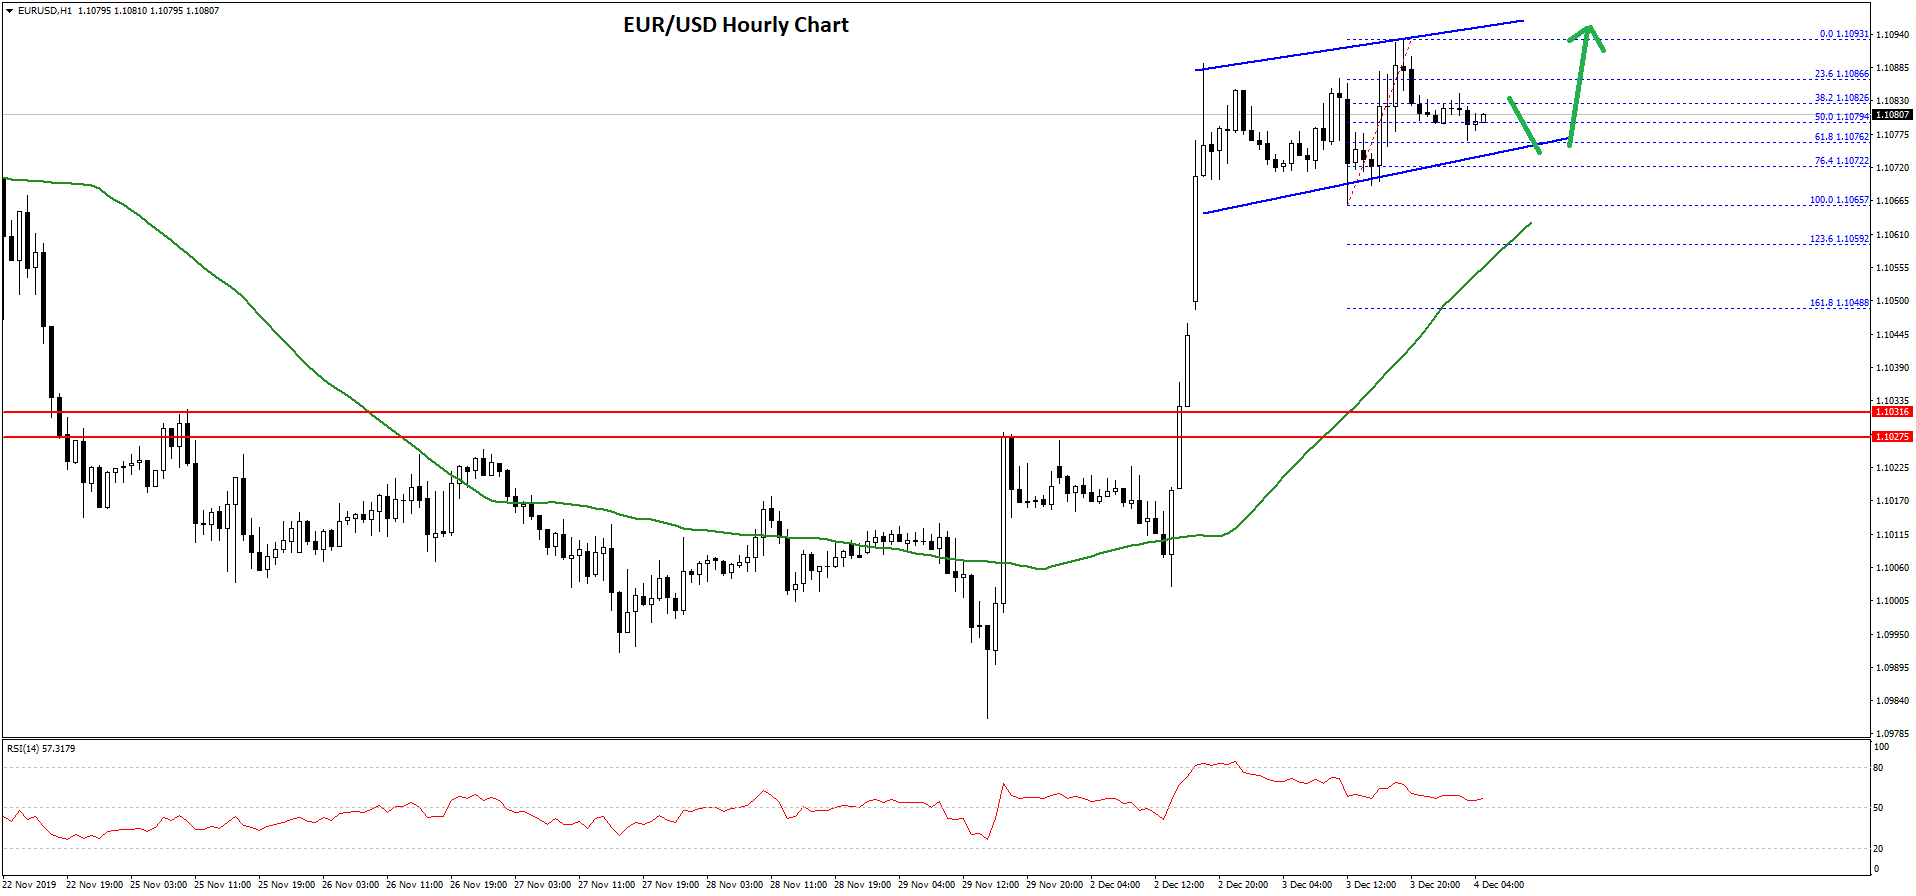
A high was formed near 1.1093 on FXOpen and the pair is currently consolidating gains. Recently, it corrected below the 50% Fib retracement level of the upward move from the 1.1065 low to 1.1093 high.
However, the 1.1075 level seems to be providing support. Besides, there is a short term ascending channel forming with support near 1.1075 on the hourly chart of EUR/USD.
The 61.8% Fib retracement level of the upward move from the 1.1065 low to 1.1093 high is also near 1.1075. Therefore, a downside break below 1.1075 and 1.1065 could start a major downside correction towards the 1.1050 and 1.1035 support levels.
On the upside, an initial resistance is near the 1.1090 and 1.1100 levels. A clear break above the 1.1100 resistance area could set the pace for a strong rise towards the 1.1140 and 1.1150 resistance levels in the near term.
USD/JPY Technical Analysis
The US Dollar struggled to clear the 109.70 and 109.80 resistance levels against the Japanese Yen. As a result, the USD/JPY pair started a strong decline below the 109.50 support area.
Moreover, the pair traded below a couple of important bullish trend lines near 109.50 on the hourly chart. The decline was such that the pair tumbled below the 109.00 support and the 50 hourly simple moving average.
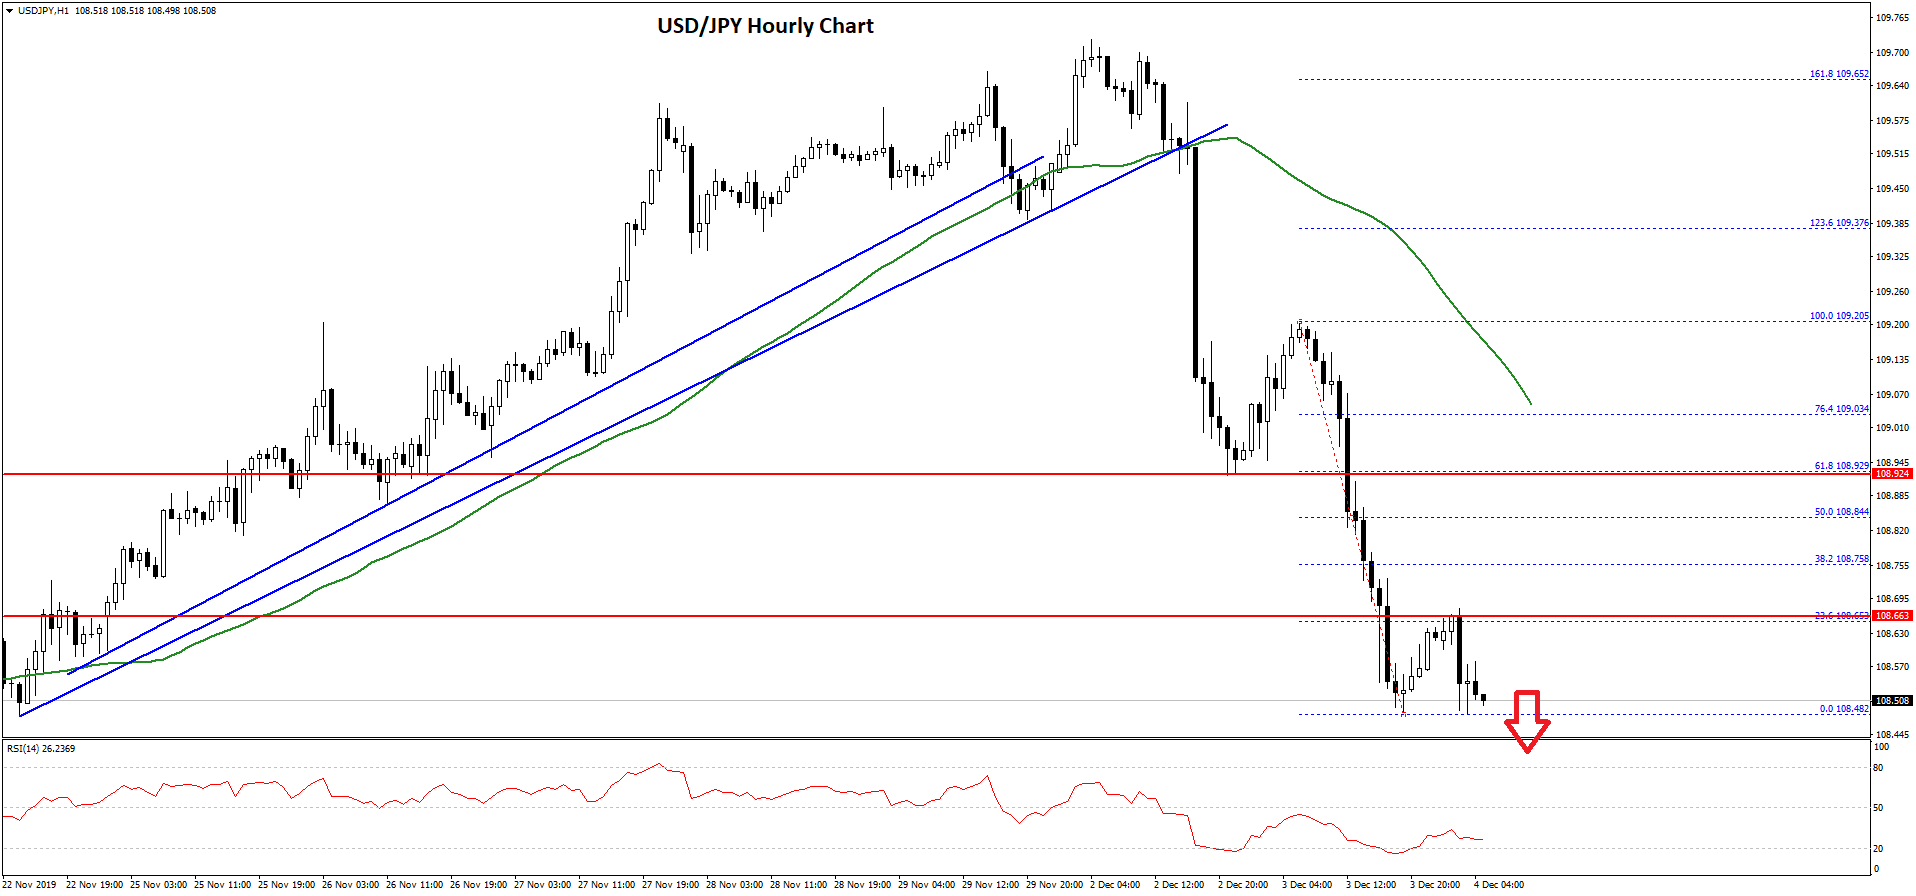
Finally, the price traded below the 108.65 support and a new weekly low was formed near 108.48. The pair is still trading with a bearish angle below the 108.65 level.
An immediate resistance is near the 23.6% Fib retracement level of the recent decline from the 109.20 high to 108.48 low. If there is an upside correction above the 108.65 level, the pair could test the 108.80 resistance.
Besides, the 50% Fib retracement level of the recent decline from the 109.20 high to 108.48 low may perhaps act as a strong resistance near the 108.85 level.
On the downside, an initial support is near the 108.45 level. If USD/JPY fails to stay above 108.45 and 108.40, there is a risk of an extended decline towards the 108.00 support area in the near term. Any further losses could lead the pair towards 107.85.
Trade over 50 forex markets 24 hours a day with FXOpen. Take advantage of low commissions, deep liquidity, and spreads from 0.0 pips (additional fees may apply). Open your FXOpen account now or learn more about trading forex with FXOpen.
This article represents the opinion of the Companies operating under the FXOpen brand only. It is not to be construed as an offer, solicitation, or recommendation with respect to products and services provided by the Companies operating under the FXOpen brand, nor is it to be considered financial advice.
Stay ahead of the market!
Subscribe now to our mailing list and receive the latest market news and insights delivered directly to your inbox.


Latest articles

EUR/USD and GBP/USD consolidate ahead of the Fed decision
European currencies are showing subdued dynamics, entering a consolidation phase following their previous advance. Earlier, EUR/USD and GBP/USD broke out of their ranges and strengthened; however, the subsequent correction has led both pairs to retest the previously breached

Meta: V-Shaped Recovery Meets Heavy Volume Resistance
The movement in Meta Platforms shares is being driven by two competing narratives. On one hand, advertising revenue is benefiting from AI-based tools: the Advantage+ platform continues to support strong advertiser demand, and the analyst consensus for Q1 2026 revenue

Commodity Currencies Test Key Levels Ahead of Major Macro Data
Commodity-linked currencies are trading near key levels, showing restrained price action as market participants adopt a wait-and-see approach. The fundamental backdrop is shaped by expectations surrounding the release of Australia’s inflation data and the Bank of Canada’s interest