


EUR/USD Recovers Ground, USD/CHF Could Extend Losses
FXOpen

EUR/USD started a decent increase from the 1.0350 zone. USD/CHF is sliding and might extend losses below the 0.9900 support zone.
Important Takeaways for EUR/USD and USD/CHF
· The Euro started a recovery wave from the 1.0350 support zone against the US Dollar.
· There was a break above a major bearish trend line with resistance near 1.0515 on the hourly chart of EUR/USD.
· USD/CHF topped near the 1.0060 zone and started a downside correction.
· There was a break below a connecting bullish trend line with support near 1.0020 on the hourly chart.
EUR/USD Technical Analysis
The Euro formed a base above the 1.0350 zone and started a decent increase against the US Dollar. The EUR/USD pair climbed above the 1.0420 resistance zone to move into a bullish zone.
There was a steady increase above the 1.0500 resistance zone and the 50 hourly simple moving average. Besides, there was a break above a major bearish trend line with resistance near 1.0515 on the hourly chart of EUR/USD.
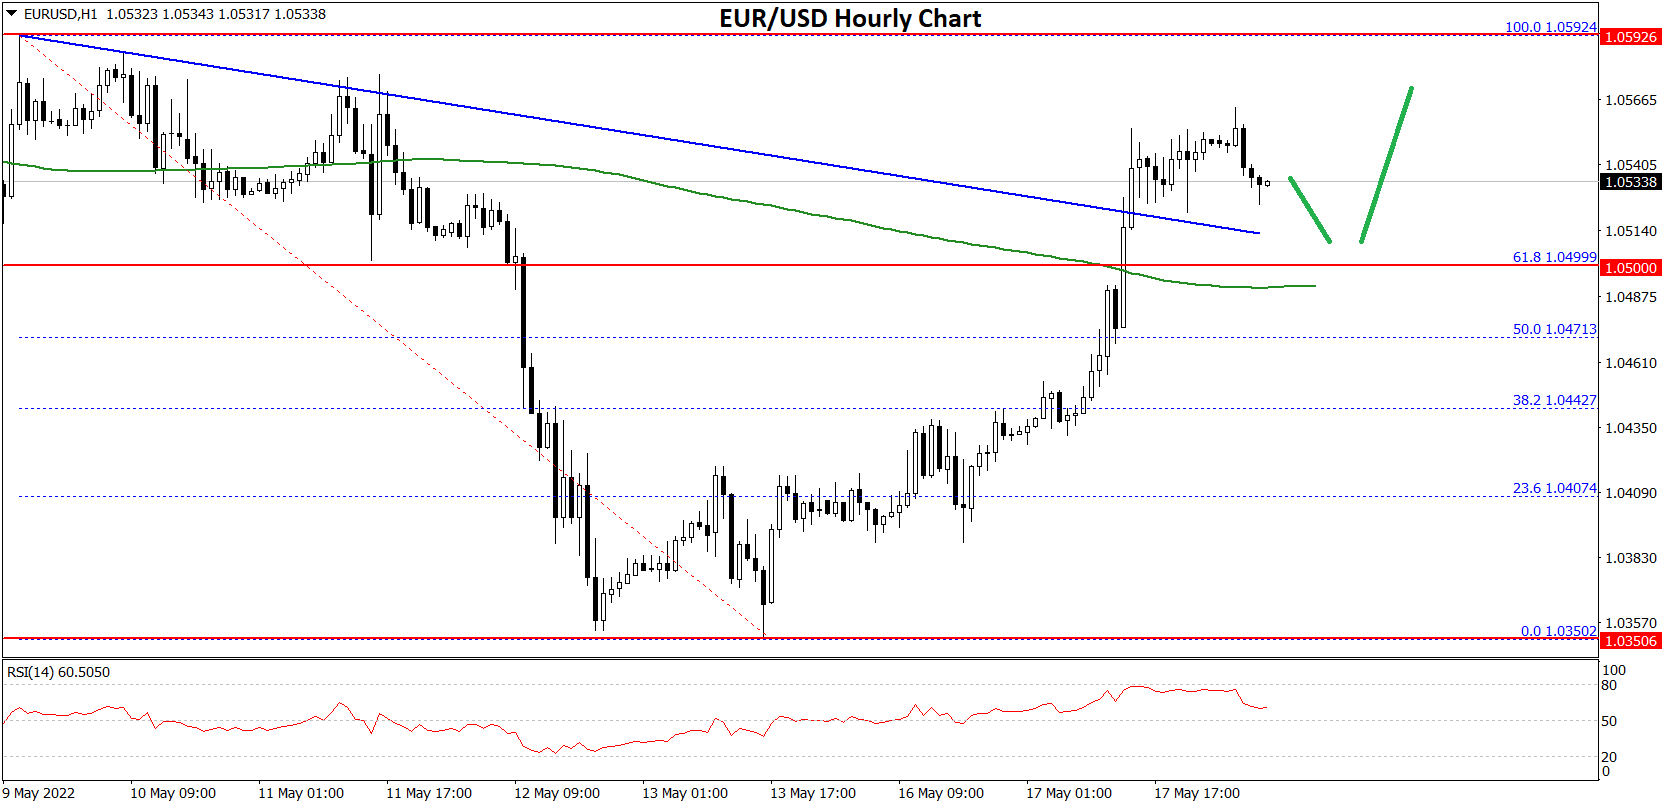
There was a clear move above the 50% Fib retracement level of the key decline from the 1.0592 swing high (formed on FXOpen) to 1.0350 low.
It is now consolidating near the 1.0550 level and the 61.8% Fib retracement level of the key decline from the 1.0592 swing high to 1.0350 low. On the upside, an initial resistance is near the 1.0550 level. The next major resistance is near the 1.0580 level.
A clear move above the 1.0580 resistance zone could set the pace for a larger increase towards 1.0650. The next major resistance is near the 1.0750 zone.
On the downside, an immediate support is near the 1.0500 level. The next major support is near the 1.0480 level. A downside break below the 1.0480 support could start another decline.
USD/CHF Technical Analysis
The US Dollar faced sellers near the 1.0060 zone against the Swiss franc. The USD/CHF pair started a downside correction below the 1.0020 support zone.
There was a break below a connecting bullish trend line with support near 1.0020 on the hourly chart. The pair traded below the 50% Fib retracement level of the upward move from the 0.9872 swing low to 1.0064 high.
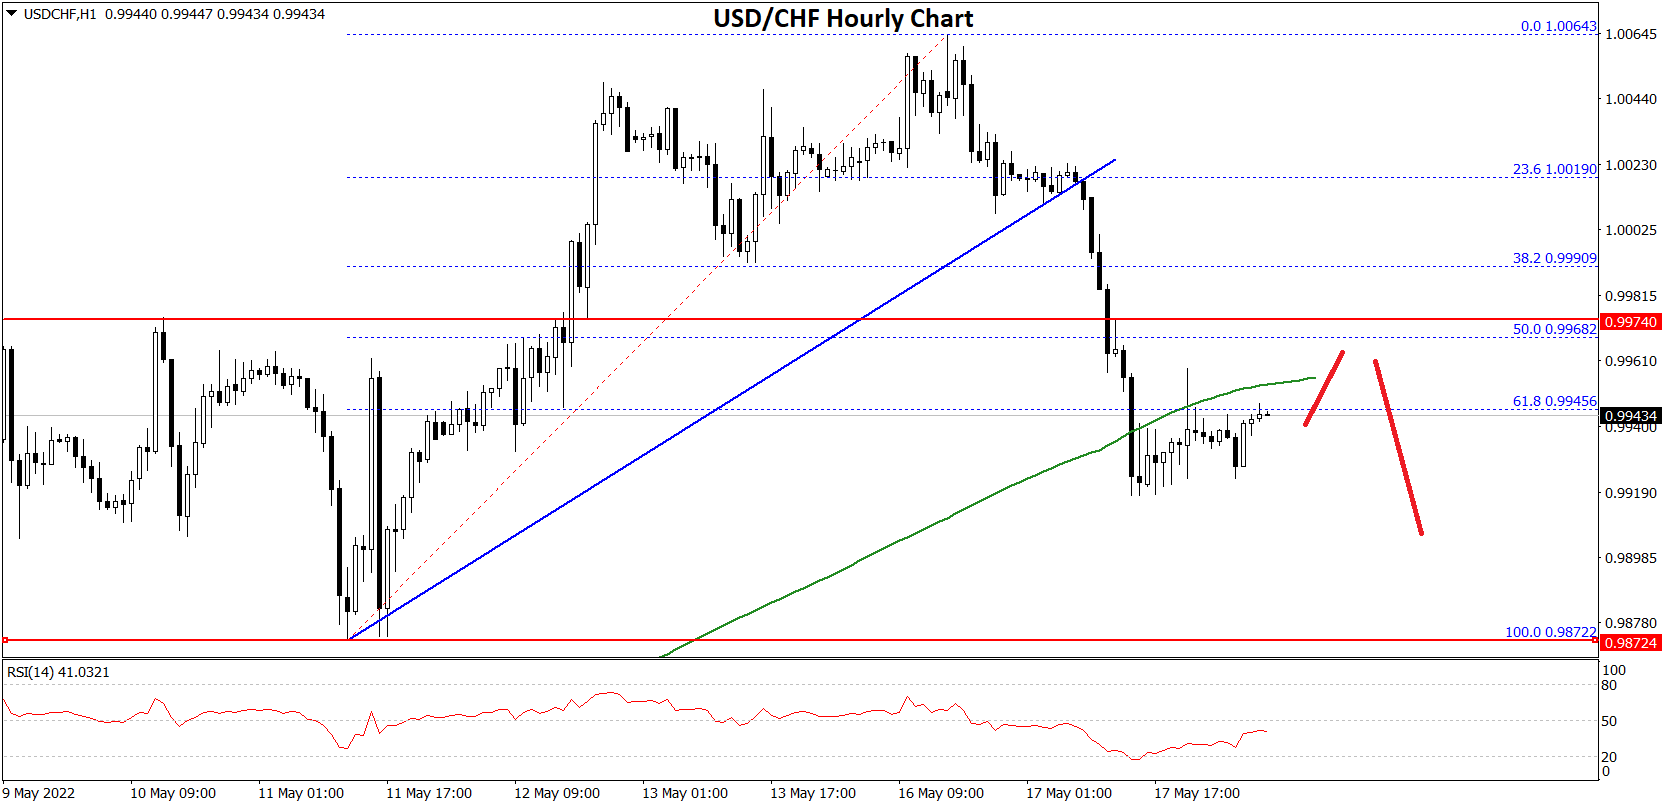
The pair is now trading below the 0.9950 level and the 50 hourly simple moving average. It even moved below the 61.8% Fib retracement level of the upward move from the 0.9872 swing low to 1.0064 high.
If the bears remain in action, the pair could decline towards the 0.9870 support. The main support is now forming near the 0.9840 level. Any more losses may possibly open the doors for a move towards the 0.9800 level, where the bulls might take a stand.
On the upside, the pair is now facing resistance near the 0.9965 level. The next major resistance is near the 1.0020 level. If there is a clear break above the 1.0020 resistance zone, the pair could start another increase.
The next major resistance is near the 1.0060. Any more gains could send the pair towards the 1.0120 level in the near term.
This forecast represents FXOpen Markets Limited opinion only, it should not be construed as an offer, invitation or recommendation in respect to FXOpen Markets Limited products and services or as financial advice.
Trade over 50 forex markets 24 hours a day with FXOpen. Take advantage of low commissions, deep liquidity, and spreads from 0.0 pips (additional fees may apply). Open your FXOpen account now or learn more about trading forex with FXOpen.
This article represents the opinion of the Companies operating under the FXOpen brand only. It is not to be construed as an offer, solicitation, or recommendation with respect to products and services provided by the Companies operating under the FXOpen brand, nor is it to be considered financial advice.
Stay ahead of the market!
Subscribe now to our mailing list and receive the latest market news and insights delivered directly to your inbox.


Latest articles

Fed vs ECB vs BOJ — Key Considerations for H2 2026
At the start of 2026, markets expected Fed cuts, BOJ hikes, and an ECB pause.
But rising inflation, higher energy prices, resilient US growth, and shifting central bank rhetoric are forcing traders to rethink the entire macro outlook for H2

Overbought vs Oversold Stocks Explained
An overbought

GBP/USD: Sterling Under Pressure Despite Strong GDP Data
Fundamental Background
UK GDP grew by 0.6% in the first quarter of 2026, notably above the revised 0.2% reading recorded in the fourth quarter of 2025. The main contribution came from the services sector, which expanded by 0.