


EUR/USD Remains At Risk, USD/CHF Eyes Larger Increase
FXOpen
EUR/USD declined heavily below 1.1900 and it tested 1.1770. USD/CHF is rising and it could gain momentum if it manages to clear the 0.9200 resistance.
Important Takeaways for EUR/USD and USD/CHF
- The Euro started a fresh decline from well above the 1.1900 zone against the US Dollar.
- There was a break below a major contracting triangle with support near 1.1855 on the hourly chart of EUR/USD.
- USD/CHF started a fresh increase after it found support near 0.9123.
- There was a break above a key bearish trend line with resistance near 0.9168 on the hourly chart.
EUR/USD Technical Analysis
The Euro struggled to gain pace above the 1.1900 level and it started a major decline against the US Dollar. As a result, the EUR/USD pair broke the 1.1850 support zone to move into a bearish zone.
The pair even declined below the 1.1820 support zone and settled below the 50 hourly simple moving average. There was also a break below a major contracting triangle with support near 1.1855 on the hourly chart of EUR/USD.
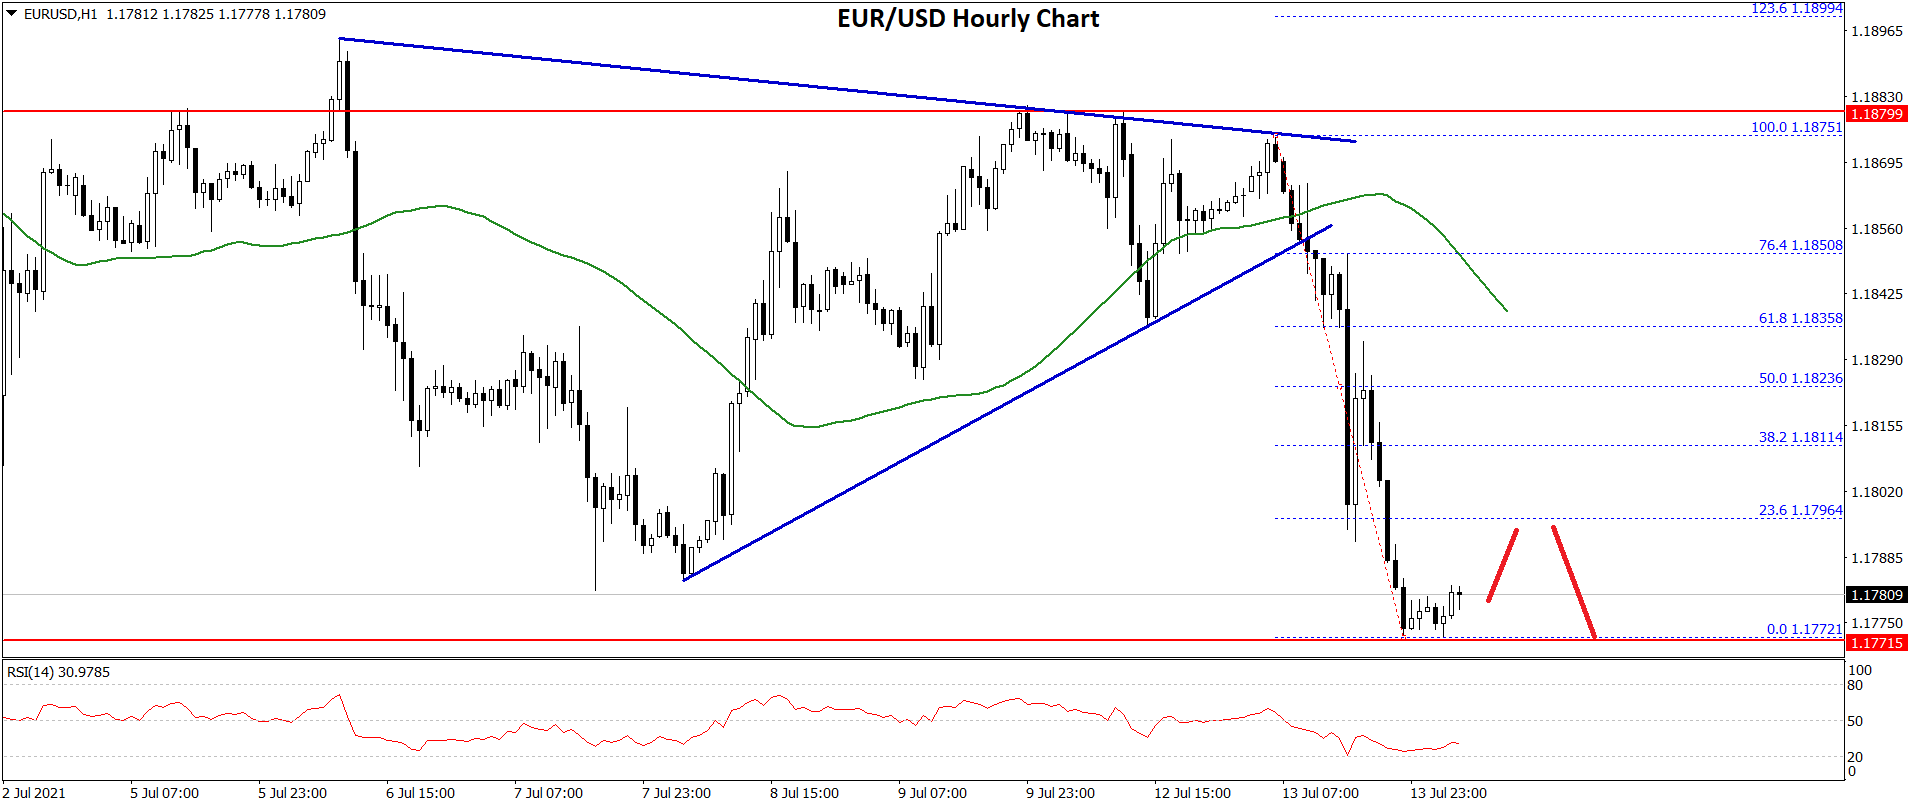
A low was formed near 1.1772 on FXOpen and the pair is now consolidating losses. An immediate resistance on the upside is near the 1.1795 level.
It is near the 23.6% Fib retracement level of the recent drop from the 1.1875 high to 1.1772 low. If there is an upside break above the 1.1800 resistance zone, the price could recover steadily towards the 1.1825 resistance zone.
The 50% Fib retracement level of the recent drop from the 1.1875 high to 1.1772 low is also near 1.1825. Any more gains might call for a test of 1.1850.
On the downside, there is a major support forming near the 1.1770 zone. A downside break below the 1.1770 support could start another decline. The next major support could be near the 1.1710 level.
USD/CHF Technical Analysis
The US Dollar formed a strong support above the 0.9130 level against the Swiss franc. As a result, the USD/CHF pair started a fresh increase above the 0.9150 resistance.
The pair broke the 0.9165 resistance and the 50 hourly simple moving average. It even traded above the 38.2% Fib retracement level of the main decline from the 0.9267 high to 0.9132 low.
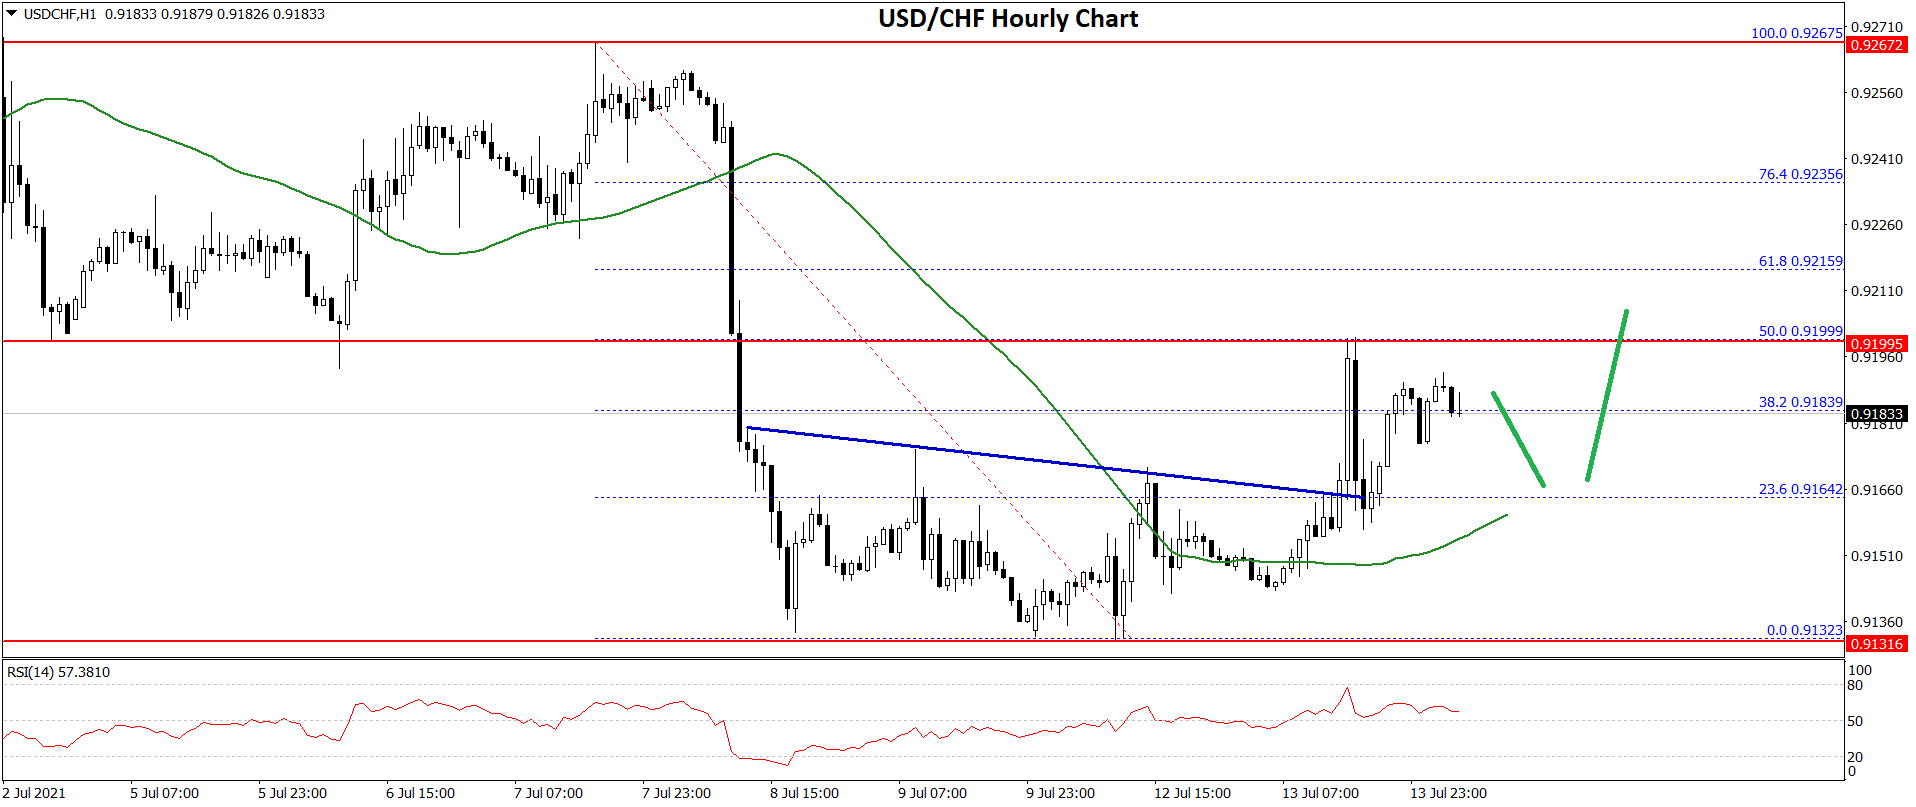
There was also a break above a key bearish trend line with resistance near 0.9168 on the hourly chart. It is now trading near the 50% Fib retracement level of the main decline from the 0.9267 high to 0.9132 low.
If there is a clear break above the 0.9200 resistance zone, the pair could start a steady increase. The next major resistance is near the 0.9220. A successful break above the 0.9220 resistance could open the doors for a move towards 0.9265. Any more gains could lead the pair towards 0.9300.
On the downside, the pair might find bids near the 0.9165 level and the 50 hourly SMA. Any more losses could lead the pair towards the 0.9135 support zone.
If the bulls fail to protect the 0.9135 support zone, there is a risk of a larger decline. In the stated case, the pair may even decline below the 0.9100 support zone.
This forecast represents FXOpen Markets Limited opinion only, it should not be construed as an offer, invitation or recommendation in respect to FXOpen Markets Limited products and services or as financial advice.
Trade over 50 forex markets 24 hours a day with FXOpen. Take advantage of low commissions, deep liquidity, and spreads from 0.0 pips (additional fees may apply). Open your FXOpen account now or learn more about trading forex with FXOpen.
This article represents the opinion of the Companies operating under the FXOpen brand only. It is not to be construed as an offer, solicitation, or recommendation with respect to products and services provided by the Companies operating under the FXOpen brand, nor is it to be considered financial advice.
Stay ahead of the market!
Subscribe now to our mailing list and receive the latest market news and insights delivered directly to your inbox.


Latest articles

DAX 40: consolidation amid technology sell-off
A wave of selling in the technology sector that emerged earlier this week has weighed on European equities. The trigger was investor concern over the profitability of large-scale debt-funded investments by major US tech companies in AI infrastructure. The Nasdaq

Euro Hits Fresh Yearly Lows Amid Dovish ECB Signals
The euro remains under pressure following weak macroeconomic data from the euro area and fresh signals that the European Central Bank is prepared to maintain a more accommodative monetary policy stance. Data released yesterday pointed to a deterioration in business

Pound at Key Levels: Markets Assess Impact of Political Uncertainty in the UK
The British pound remains under pressure following increased political uncertainty in the United Kingdom triggered by the Prime Minister’s resignation. Investors are assessing potential shifts in the political and economic policy outlook after the head of government stepped down,