


EUR/USD Remains In Downtrend While USD/CHF Is Rising
FXOpen
EUR/USD is under pressure and showing bearish signs below the 1.0880 resistance area. Conversely, USD/CHF is likely to continue higher above the 0.9720 resistance.
Important Takeaways for EUR/USD and USD/CHF
- The Euro remained in a bearish zone below the 1.0900 pivot level against the US Dollar.
- There is a major bearish trend line forming with resistance near 1.0865 on the hourly chart of EUR/USD.
- USD/CHF is currently following a bullish path and trading nicely above the 0.9650 support.
- There is a crucial bullish trend line forming with support near 0.9680 on the hourly chart.
EUR/USD Technical Analysis
In the past few days, the Euro declined steadily from well above the 1.0950 level against the US Dollar. The EUR/USD pair broke the key 1.0900 pivot level to move into a bearish zone.
Moreover, there was a break below the 1.0880 support and the 50 hourly simple moving average. The pair traded as low as 1.0816 on FXOpen and it is currently attempting a decent recovery.
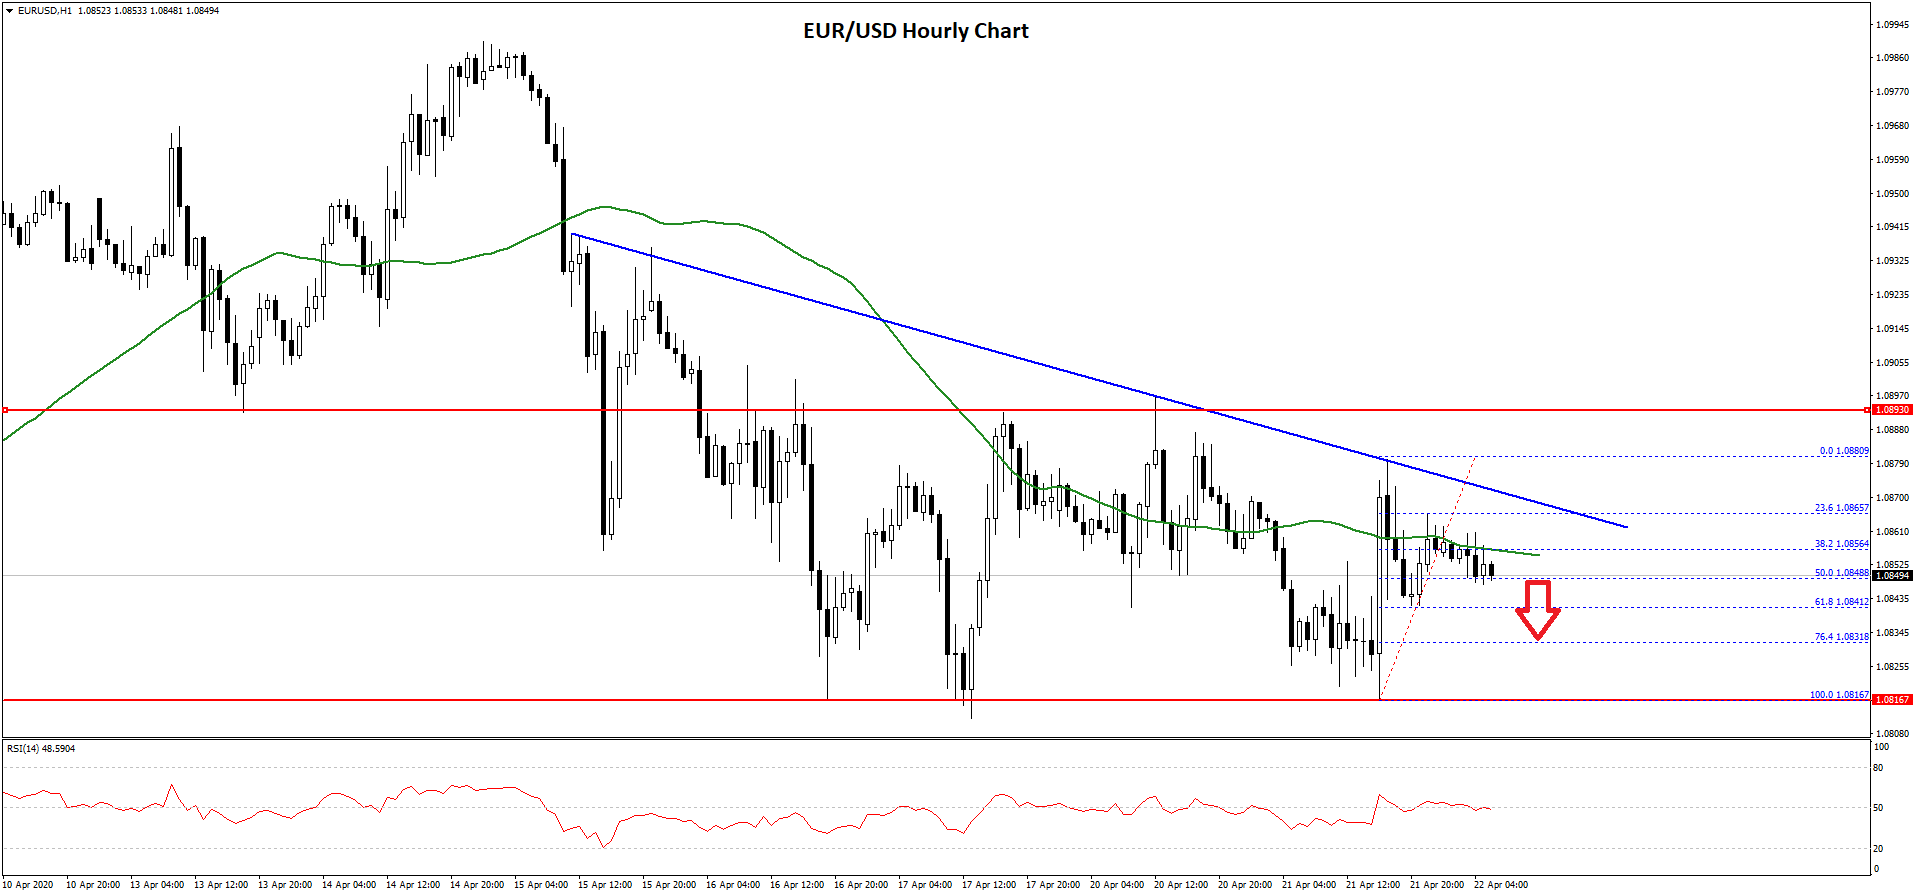
The pair recovered above 1.0850, but the 1.0880 level is acting as a resistance. Besides, there is a major bearish trend line forming with resistance near 1.0865 on the hourly chart of EUR/USD.
It is currently declining and testing the 50% Fib retracement level of the recent upward move from the 1.0816 low to 1.0880 high. If the pair fails to stay above 1.0850, it could extend its decline.
The next key support is near the 1.0830 level since it is close to the 76.4% Fib retracement level of the recent upward move from the 1.0816 low to 1.0880 high. Any further losses could open the doors for more losses towards the 1.0800 level.
On the upside, the 1.0865 level is a major barrier, followed by 1.0880. To move into a positive zone, EUR/USD must gain momentum above 1.0880 and then settle above the 1.0900 pivot level in the near term.
USD/CHF Technical Analysis
The US Dollar started a steady rise from the 0.9600 support area against the Swiss franc. The USD/CHF pair surpassed the 0.9650 resistance level to move into a bullish zone.
Besides, there was a proper close above the 0.9680 level and the 50 hourly simple moving average. Finally, it broke the 0.9700 area and tested the 0.9720 resistance area. A high is formed near 0.9726 and the pair corrected lower.
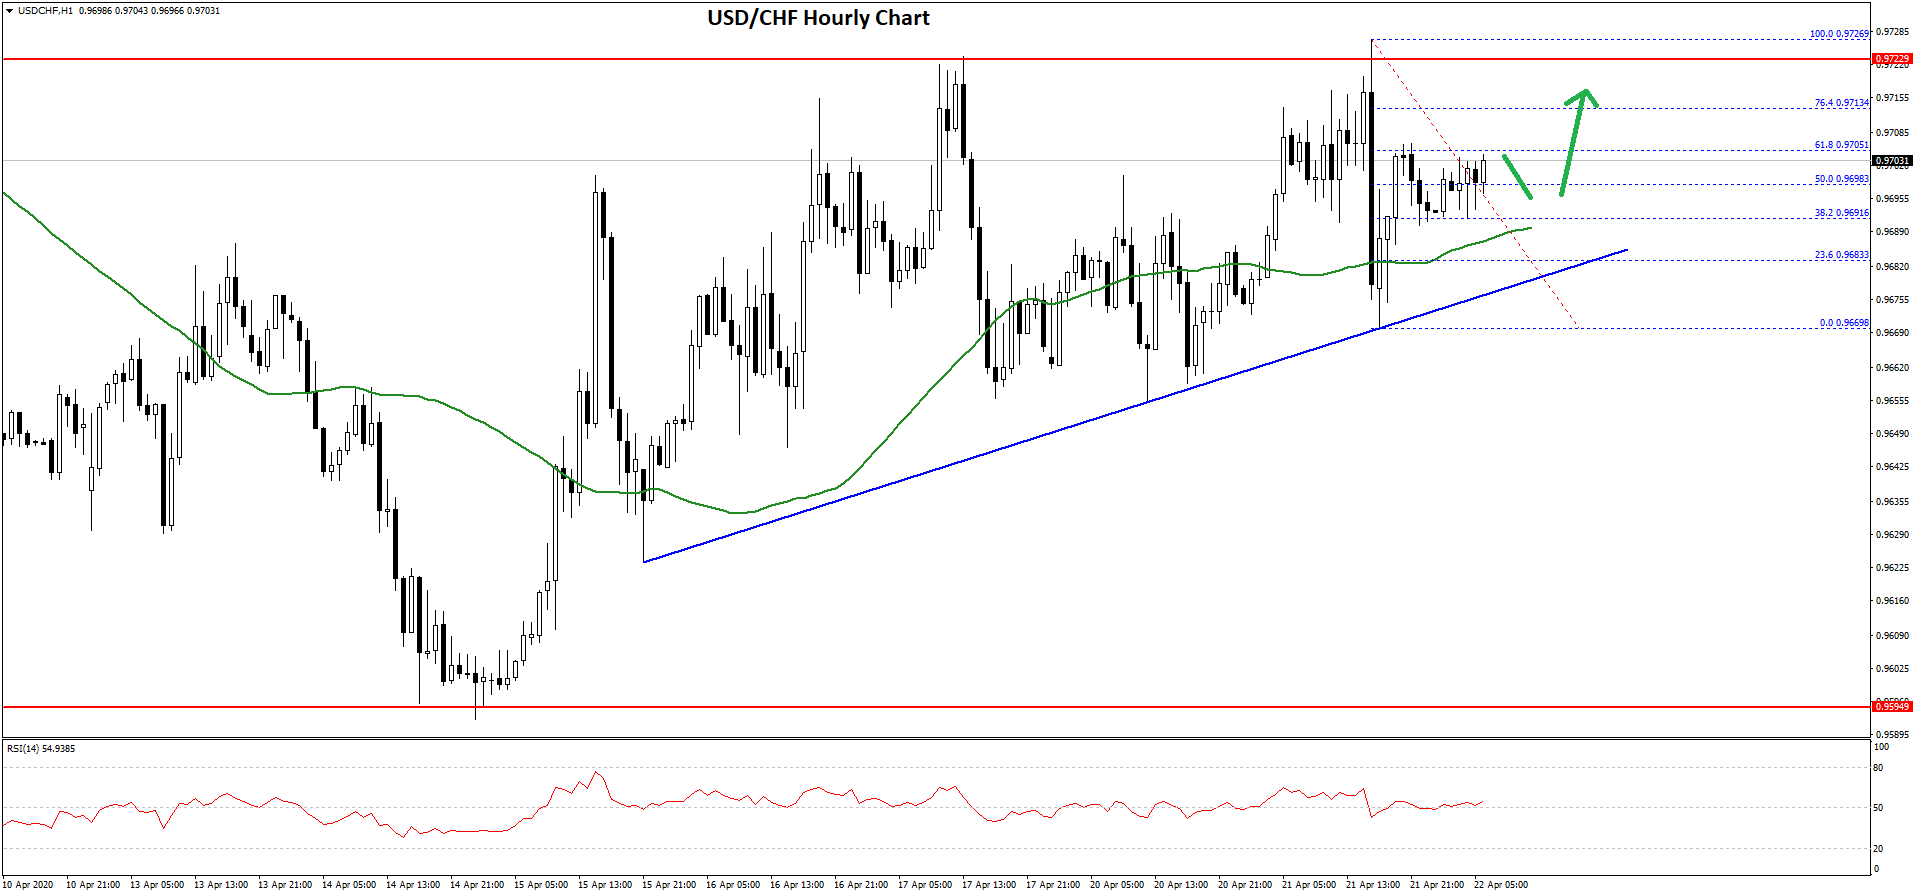
It tested the 0.9670 level and it is currently rising. There was a break above the 50% Fib retracement level of the recent decline from the 0.9726 high to 0.9669 low. However, the pair seems to be struggling near the 0.9700 region.
Besides, the 61.8% Fib retracement level of the recent decline from the 0.9726 high to 0.9669 low is also acting as a resistance. Therefore, the pair must settle above 0.9705 to continue higher.
The main hurdle is still near the 0.9720 level, above which the bulls are likely to aim more upsides towards the 0.9750 and 0.9760 levels.
On the downside, there is a strong support forming near the 0.9685 level and the 50 hourly simple moving average. There is also a crucial bullish trend line forming with support near 0.9680 on the hourly chart.
Overall, USD/CHF remains well supported near 0.9680 and it is likely to continue higher above 0.9720 in the near term.
Trade over 50 forex markets 24 hours a day with FXOpen. Take advantage of low commissions, deep liquidity, and spreads from 0.0 pips (additional fees may apply). Open your FXOpen account now or learn more about trading forex with FXOpen.
This article represents the opinion of the Companies operating under the FXOpen brand only. It is not to be construed as an offer, solicitation, or recommendation with respect to products and services provided by the Companies operating under the FXOpen brand, nor is it to be considered financial advice.
Stay ahead of the market!
Subscribe now to our mailing list and receive the latest market news and insights delivered directly to your inbox.


Latest articles

EUR/USD Eyes Gains As USD/CHF Weakness Deepens Again
EUR/USD started a fresh increase above 1.1700 and 1.1720. USD/CHF declined further and is now struggling below 0.7835.
Important Takeaways for EUR/USD and USD/CHF Analysis Today
· The Euro started a decent increase from

Apple: Earnings Day Above the Activity Zone
On 30 April, after the market close, Apple Inc. will release its financial results for the second quarter of fiscal 2026. The consensus forecast, based on estimates from 31 analysts, points to revenue of around $109.7 billion, with expected

USD/JPY and USD/CHF Near Key Levels: The Dollar Supported by the Fed
The US dollar continues to trend upwards following the Federal Reserve meeting, drawing support from the regulator’s moderately hawkish stance and comments by Jerome Powell. Markets interpret the Fed’s rhetoric as a signal that restrictive policy is likely