


FXOpen
EUR/USD is facing resistance near the 1.1350 and 1.1360 levels. USD/CHF is rising, but struggling to clear the 0.9225 resistance zone.
Important Takeaways for EUR/USD and USD/CHF
· The Euro started an upside correction above the 1.1320 resistance zone against the US Dollar.
· There is a major bearish trend line with resistance near 1.1350 on the hourly chart of EUR/USD.
· USD/CHF gained pace after it cleared the 0.9200 resistance zone.
· There was a break above a key bearish trend line with resistance near 0.9192 on the hourly chart.
EUR/USD Technical Analysis
The Euro attempted an upside break above the 1.1400 level against the US Dollar. However, the EUR/USD pair failed to surpass 1.1400 and started a fresh decline.
The recent high was formed near 1.1366 on FXOpen before the pair dipped. There was a move below the 1.1340 level. The pair even declined below the 50% Fib retracement level of the upward move from the 1.1286 swing low to 1.1366 high.
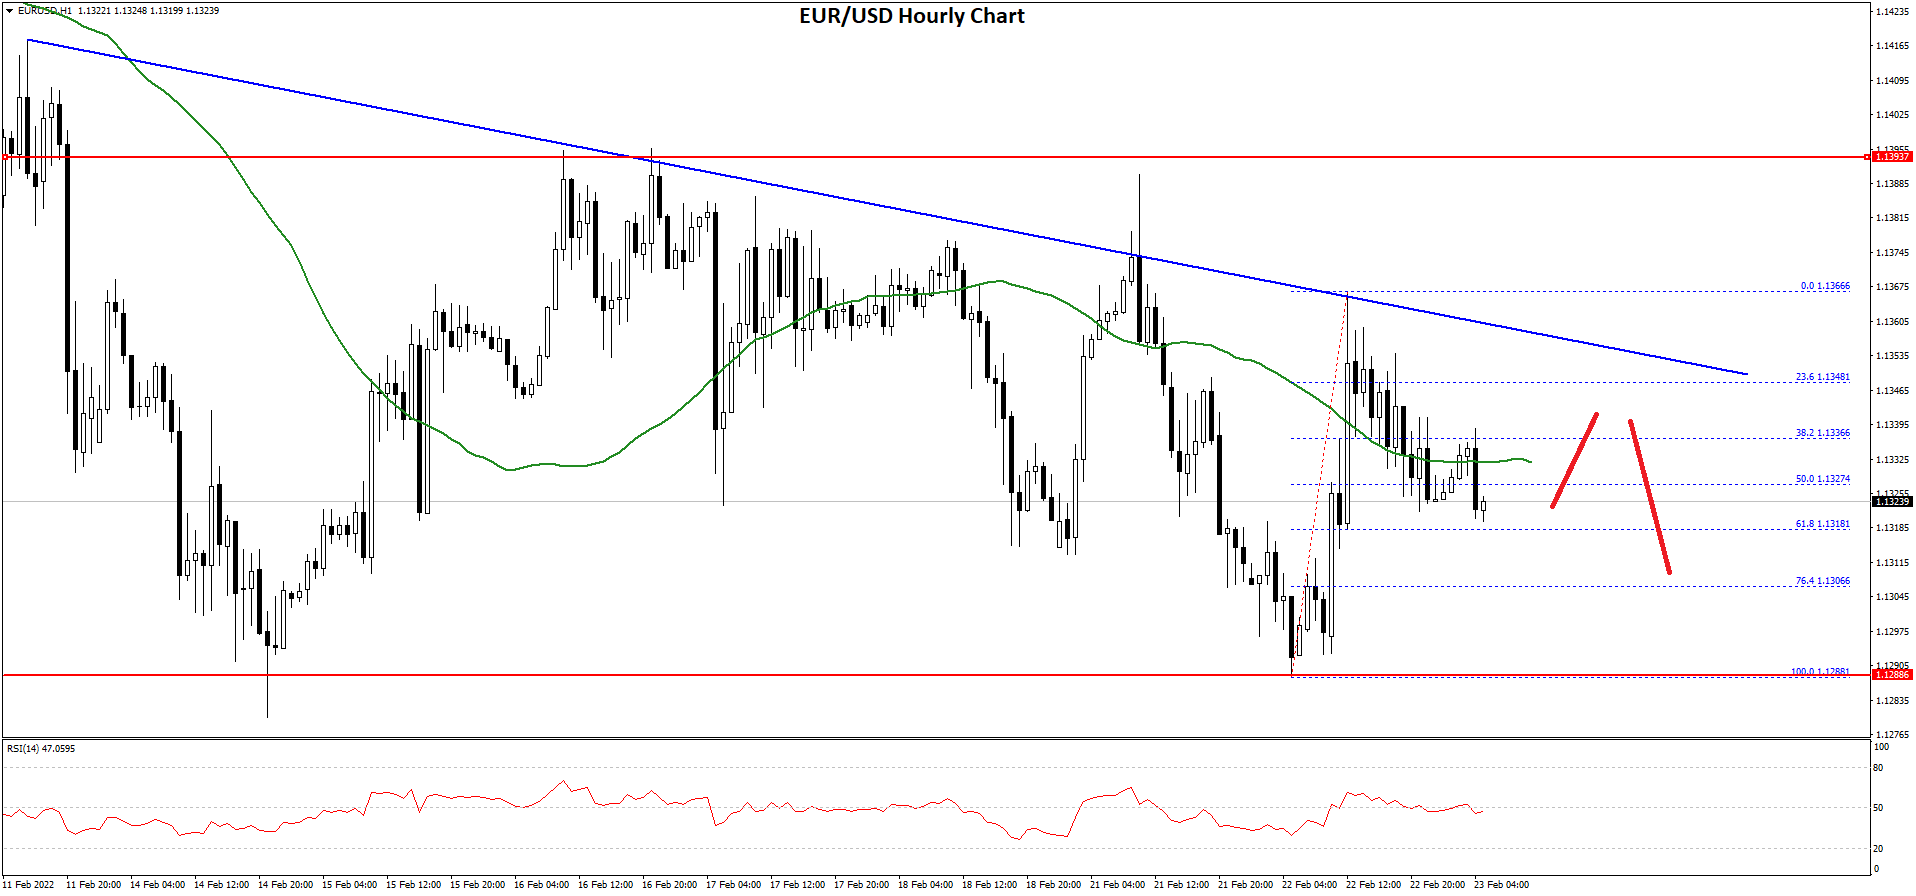
It is now trading below the 1.1335 level and the 50 hourly simple moving average. On the downside, an immediate support is near the 1.1320 level.
The 61.8% Fib retracement level of the upward move from the 1.1286 swing low to 1.1366 high is also near the 1.1320 zone. The next major support is near the 1.1285 level. A downside break below the 1.1285 support could start another decline.
On the upside, an initial resistance is near the 1.1340 level. The next major resistance is near the 1.1350 zone. There is also a major bearish trend line with resistance near 1.1350 on the hourly chart of EUR/USD.
A clear upside break above the 1.1350 zone could open the doors for a steady move. The next major resistance sits near the 1.1400 level.
USD/CHF Technical Analysis
The US Dollar started a fresh increase after it formed a base above the 0.9150 level against the Swiss franc. The USD/CHF pair surpassed the 0.9180 resistance zone to move into a bullish region.
There was a clear move above the 0.9200 resistance and the 50 hourly simple moving average. Besides, there was a break above a key bearish trend line with resistance near 0.9192 on the hourly chart. The pair even spiked above the 50% Fib retracement level of the key decline from the 0.9273 swing high to 0.9150 low.
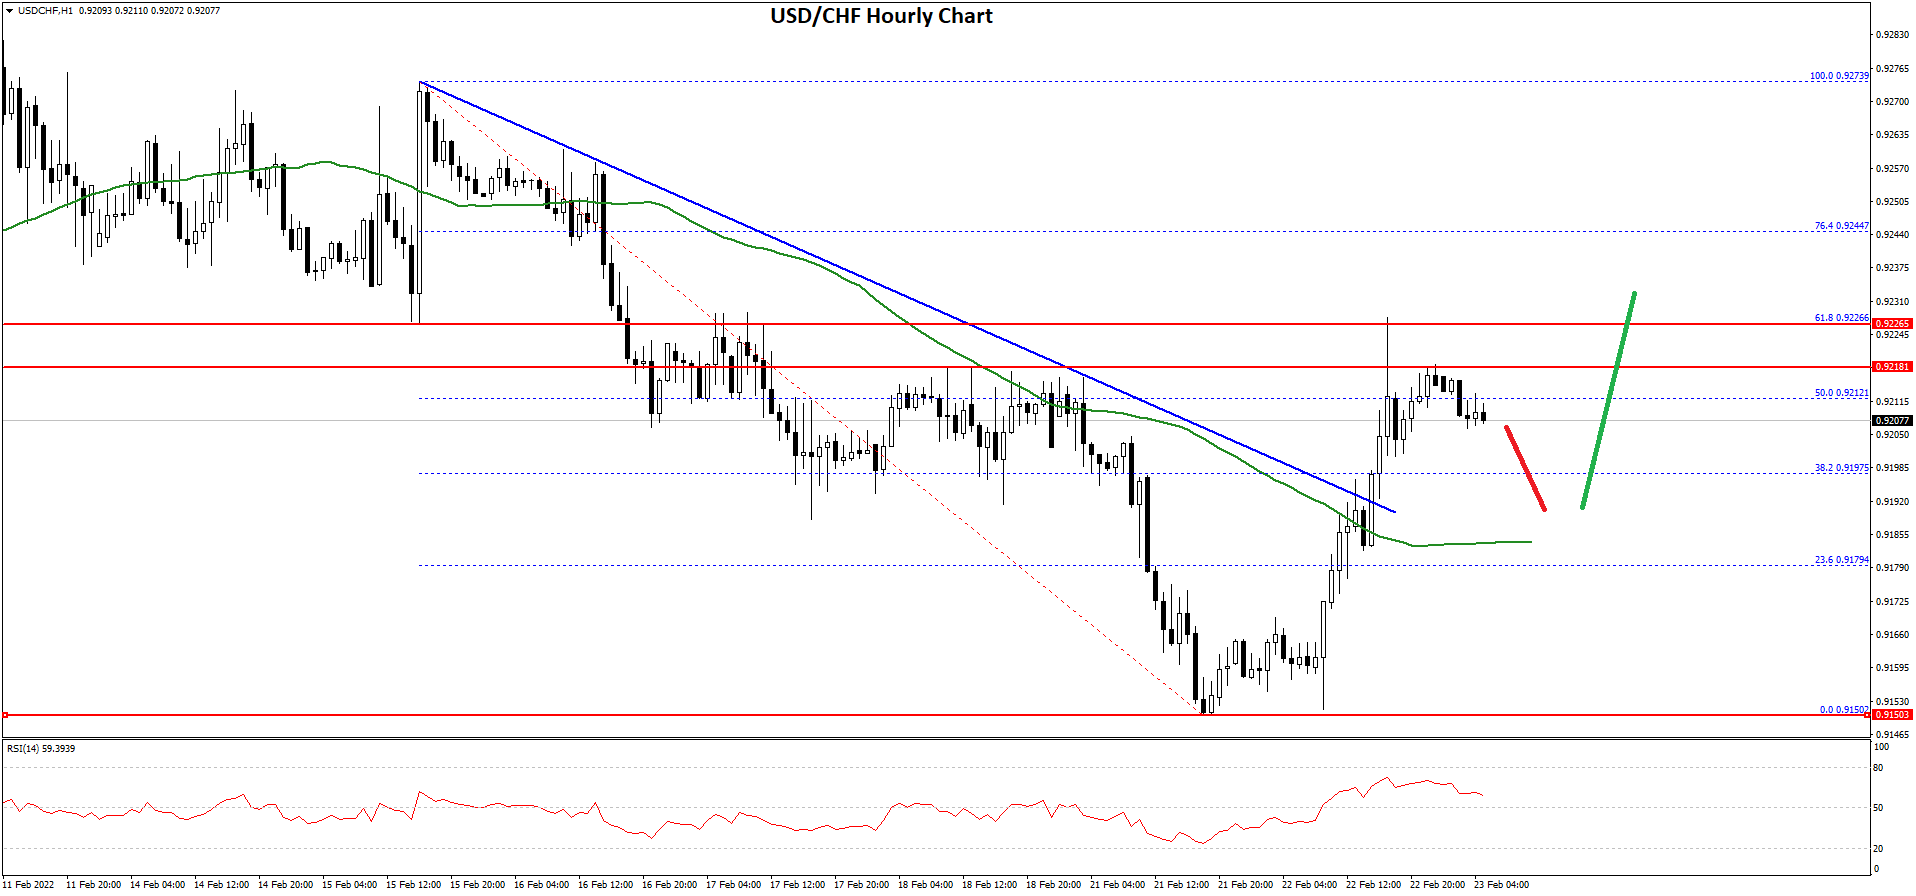
It is now facing resistance near the 0.9225 level. The 61.8% Fib retracement level of the key decline from the 0.9273 swing high to 0.9150 low is also near 0.9225.
If there is a clear break above the 0.9225 resistance zone, the pair could start another increase. The next major resistance is near the 0.9270. Any more gains could send the pair towards the 0.9300 level in the near term.
On the downside, the pair might find bids near the 0.9200 level. The main support is now forming near the 0.9180 level and the 50 hourly simple moving average.
Any more losses may possibly open the doors for a move towards the 0.9150 level. The next major support below 0.9150 is near the 0.9100.
This forecast represents FXOpen Markets Limited opinion only, it should not be construed as an offer, invitation or recommendation in respect to FXOpen Markets Limited products and services or as financial advice.
Trade over 50 forex markets 24 hours a day with FXOpen. Take advantage of low commissions, deep liquidity, and spreads from 0.0 pips (additional fees may apply). Open your FXOpen account now or learn more about trading forex with FXOpen.
This article represents the opinion of the Companies operating under the FXOpen brand only. It is not to be construed as an offer, solicitation, or recommendation with respect to products and services provided by the Companies operating under the FXOpen brand, nor is it to be considered financial advice.
Stay ahead of the market!
Subscribe now to our mailing list and receive the latest market news and insights delivered directly to your inbox.


Latest articles

FX Markets Are Changing: What’s Driving Currencies Now?
FX markets have become increasingly reactive in March, with geopolitical developments—particularly the US–Iran conflict—driving price action across currencies, commodities, and interest rate expectations.
In this update, we examine the key forces shaping the FX market right now,

GBP/USD Rises Following Bank of England Decision
Yesterday, the Bank of England’s decision had a significant impact on the pound, which strengthened against other currencies. Although the Official Bank Rate remained unchanged at 3.75%, the market was surprised by the “hawkish” signals, which sharply contrasted

S&P 500 Analysis: Index Falls to Year-to-Date Low
As the S&P 500 chart (US SPX 500 mini on FXOpen) shows, the index dropped below the 6,570 level yesterday for the first time in 2026. As a result, the equity market may be on track to