


EUR/USD Struggling While USD/CHF Could Continue Higher
FXOpen

EUR/USD is currently under a lot of pressure and trading below the 1.1100 area. Conversely. USD/CHF is rising and it is likely to continue towards the 0.9725 resistance.
Important Takeaways for EUR/USD and USD/CHF
- The Euro decline recently below the 1.1120 and 1.1100 support levels against the US Dollar.
- There was a break below a couple of bullish trend lines at 1.1134 and 1.1090 on the hourly chart of EUR/USD.
- USD/CHF is currently rising and trading above the 0.9660 support area.
- There is a key bullish trend line forming with support near the 0.9680 level on the hourly chart.
EUR/USD Technical Analysis
In the past few days, the Euro started a steady decline from well above the 1.1150 level against the US Dollar. The EUR/USD pair broke a couple of important supports near 1.1140 and 1.1120 to enter a bearish zone.
Moreover, there was a close below the 1.1120 level and the 50 hourly simple moving average. During the decline, there was a break below a couple of bullish trend lines at 1.1134 and 1.1090 on the hourly chart of EUR/USD.
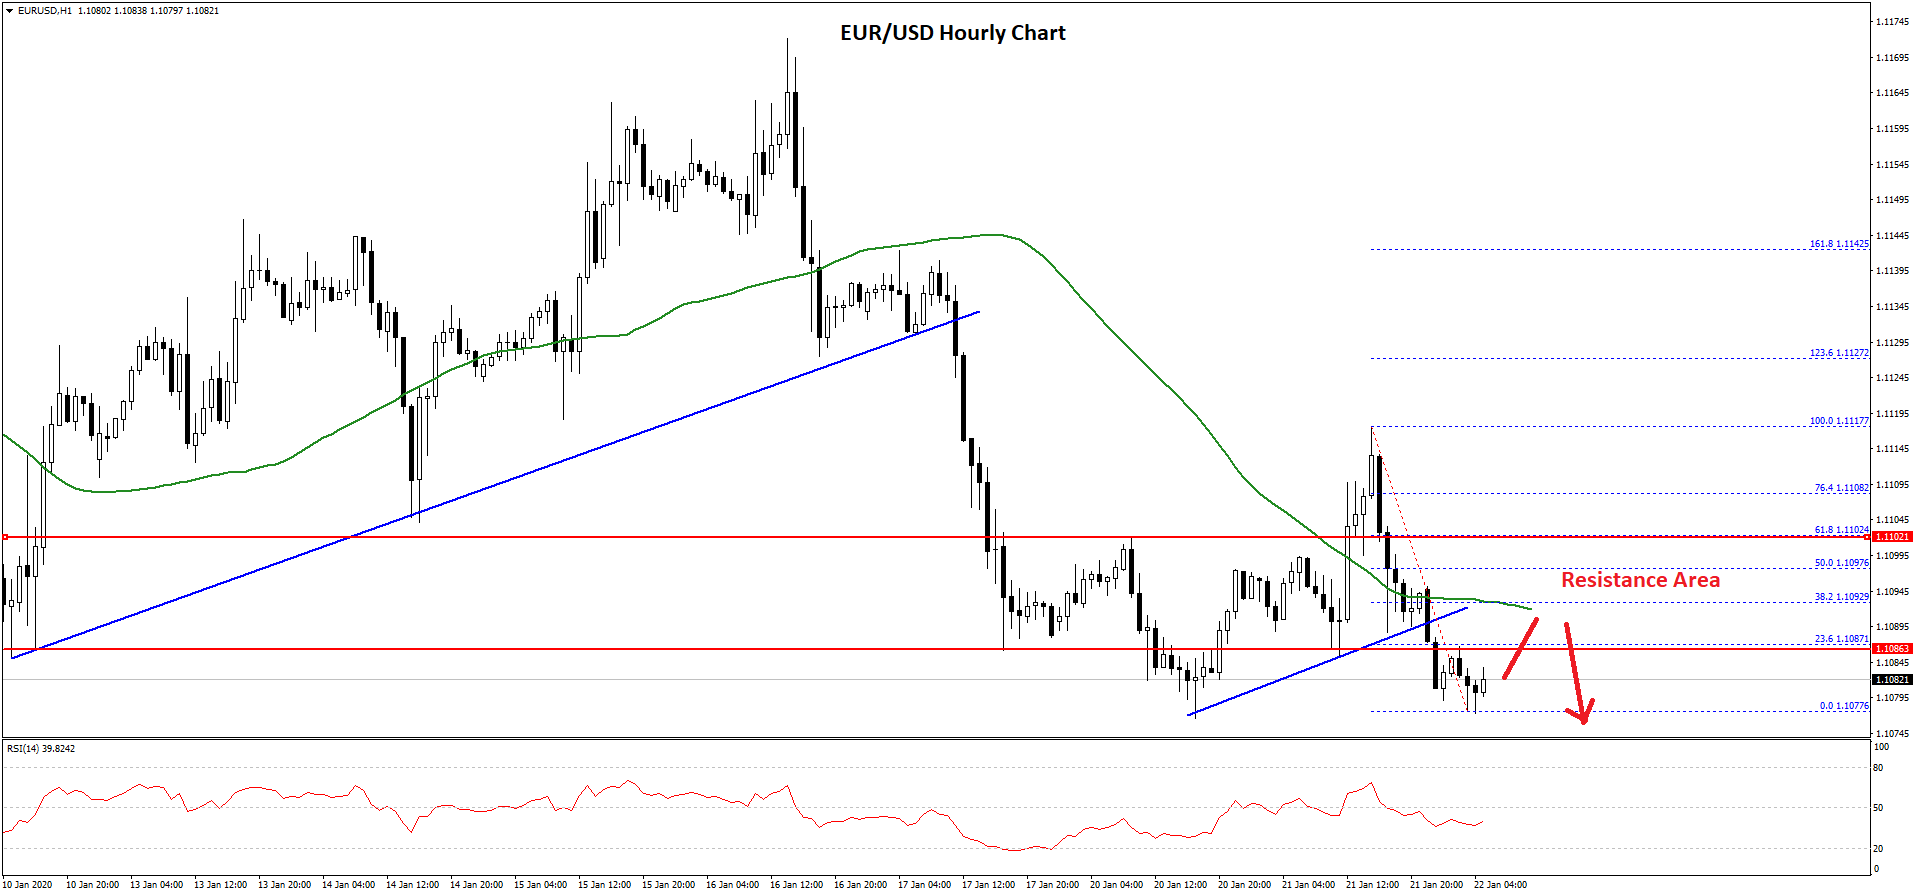
The pair even broke the 1.1080 support and traded as low as 1.1077 on FXOpen. It is currently consolidating losses near the 1.1080 level.
An initial resistance is near the 1.1088 level and the 23.6% Fib retracement level of the recent decline from the 1.1117 high to 1.1077 low. The first key resistance is near the 1.1100 area and the 50 hourly simple moving average.
Besides, the 50% Fib retracement level of the recent decline from the 1.1117 high to 1.1077 low is also near 1.1100. Therefore, EUR/USD must climb above the 1.1100 resistance area to start a decent recovering in the near term.
If there is a downside break below the 1.1077 low and 1.1075, the pair is likely to accelerate its decline. The next key support is near the 1.1040 level, where the bulls are likely to emerge.
USD/CHF Technical Analysis
The US Dollar started a steady rise from the 0.9620 support area against the Swiss franc. The USD/CHF pair followed a bullish path and traded above the 0.9650 and 0.9660 resistance levels.
Moreover, there was a close above the 0.9660 level and the 50 hourly simple moving average. The recent rise was such that the pair even broke the 76.4% Fib retracement level of the latest decline from the 0.9698 high to 0.9660 low.
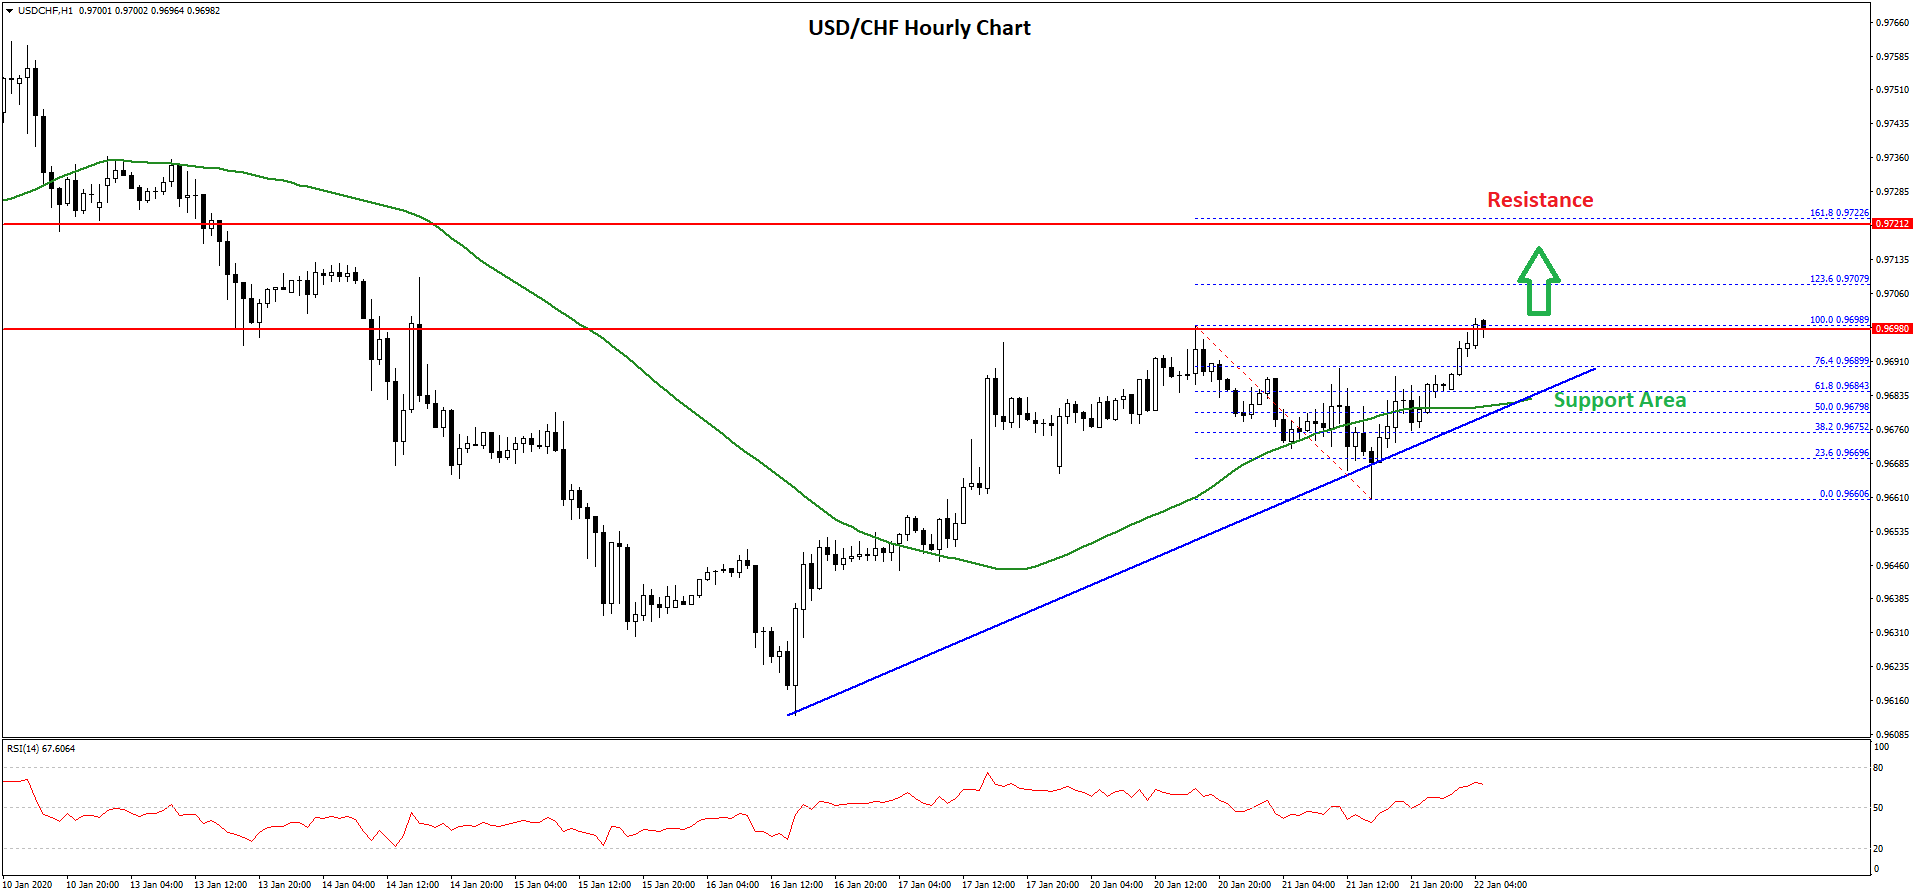
Therefore, there are high chances of more gains above the 0.9690 and 0.9700 levels in the near term. In the mentioned case, the pair could even test the 0.9725 area.
The 1.618 Fib extension level of the latest decline from the 0.9698 high to 0.9660 low at 0.9722 might act as a resistance in the short term. Any further gains might lead the pair towards the 0.9750 resistance.
On the downside, there are many supports near 0.9680 and 0.9660. Additionally, there is a key bullish trend line forming with support near the 0.9680 level on the hourly chart.
Therefore, USD/CHF is likely to remain in an uptrend unless there is a close below the 0.9680 and 0.9660 support levels in the near term. The next key support is near the 0.9620 level.
Trade over 50 forex markets 24 hours a day with FXOpen. Take advantage of low commissions, deep liquidity, and spreads from 0.0 pips (additional fees may apply). Open your FXOpen account now or learn more about trading forex with FXOpen.
This article represents the opinion of the Companies operating under the FXOpen brand only. It is not to be construed as an offer, solicitation, or recommendation with respect to products and services provided by the Companies operating under the FXOpen brand, nor is it to be considered financial advice.
Stay ahead of the market!
Subscribe now to our mailing list and receive the latest market news and insights delivered directly to your inbox.


Latest articles

Weekly Market Insights with Gary Thomson: The Week of Central Banks and Earnings
In this video, we’ll explore the key economic events and market trends, shaping the financial landscape. Get ready for insights into financial markets to help you navigate the week ahead. Let’s dive in!
In this episode of Market

Intel at a Crossroads: Earnings Beat Meets Technical Resistance
Intel has just delivered its strongest quarter in over fifteen years, and the market reaction says it all. Q2 2026 revenue surged 25% year-over-year to $16.1 billion, crushing the consensus estimate of $14.42 billion, while adjusted EPS of

Tesla: Complex Range Structure Breaks Down Following Quarterly Earnings
Tesla released its Q2 2026 results after the market closed on 22 July. Revenue increased 26% year-on-year to $28.24 billion, while vehicle deliveries reached a record 480,126 units. However, operating margin fell sharply to 1.4%, down from