


EUR/USD Struggling While USD/CHF Is Approaching Support
FXOpen

EUR/USD declined to a new multi-month low at 1.0926 and is currently correcting higher. USD/CHF is currently correcting gains, but it is approaching a few key supports near 0.9840.
Important Takeaways for EUR/USD and USD/CHF
- The Euro is correcting higher after trading to a new multi-month low at 1.0926 against the US Dollar.
- There is a major bearish trend line forming with resistance near 1.0985 on the hourly chart of EUR/USD.
- USD/CHF started a downside correction after trading as high as 0.9928.
- There was a break below a key bullish trend line with support near 0.9890 on the hourly chart.
EUR/USD Technical Analysis
In the past few weeks, the Euro remained in a bearish zone and declined steadily below the 1.1100 support against the US Dollar. The EUR/USD pair even broke the 1.1000 support to move further into a bearish zone.
The recent decline was such that the pair traded to a new multi-month low at 1.0926 on FXOpen. It is currently correcting higher and is trading above the 1.0950 level.
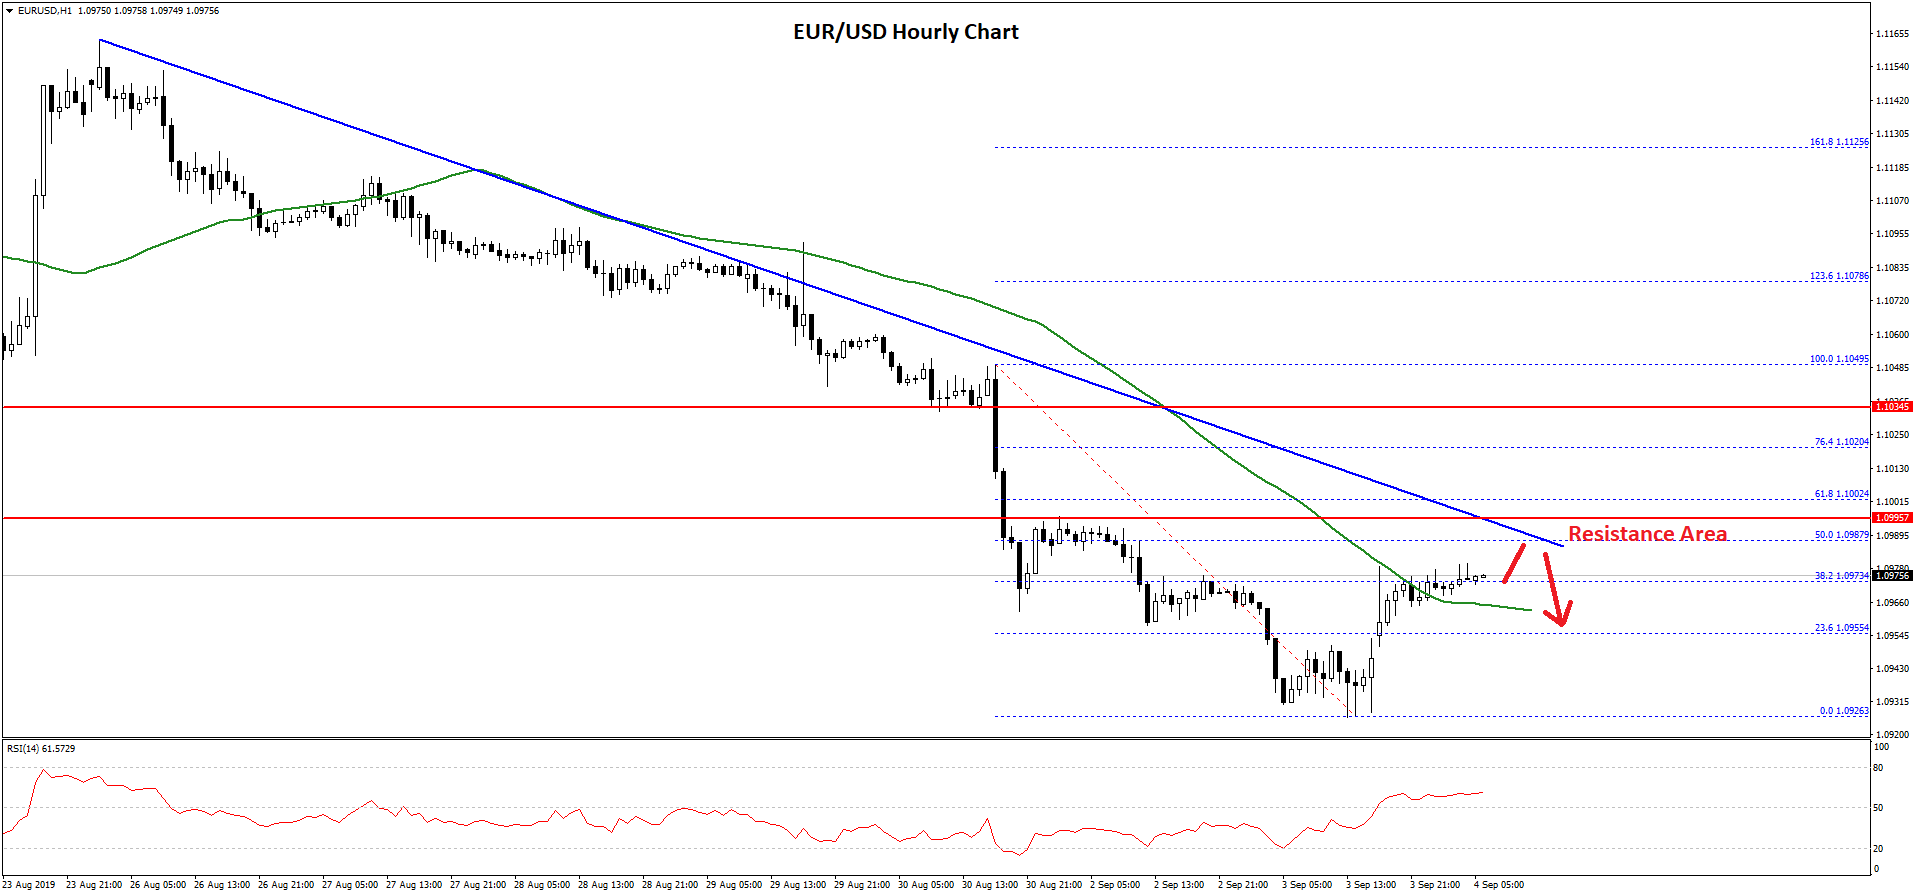
There was a break above the 23.6% Fib retracement level of the last drop from the 1.1049 high to 1.0926 low. At the moment, the pair is trading above the 1.0960 level and the 50 hourly simple moving average.
However, there are many hurdles on the upside for the bulls near the 1.0980 and 1.0990 levels. Moreover, there is a major bearish trend line forming with resistance near 1.0985 on the hourly chart of EUR/USD.
The trend line also coincides with the 50% Fib retracement level of the last drop from the 1.1049 high to 1.0926 low. If there is an upside break above the trend line and 1.1000, the pair could start a decent recovery in the near term.
On the downside, an initial support is near the 1.0950 level and the 50 hourly SMA. If EUR/USD fails to stay above the 1.0950 support, there are chances of more downsides towards 1.0925 and 1.0900 in the near term.
USD/CHF Technical Analysis
The US Dollar followed a nice bullish path from the 0.9740 support area against the Swiss franc. The USD/CHF pair broke the 0.9780 and 0.9800 resistance levels to move into a bullish zone.
Later, it gained strength above the 0.9850 and 0.9880 levels. Moreover, there was a break above the 0.9900 level and the 50 hourly simple moving average. It traded as high as 0.9928 and recently started a downside correction.
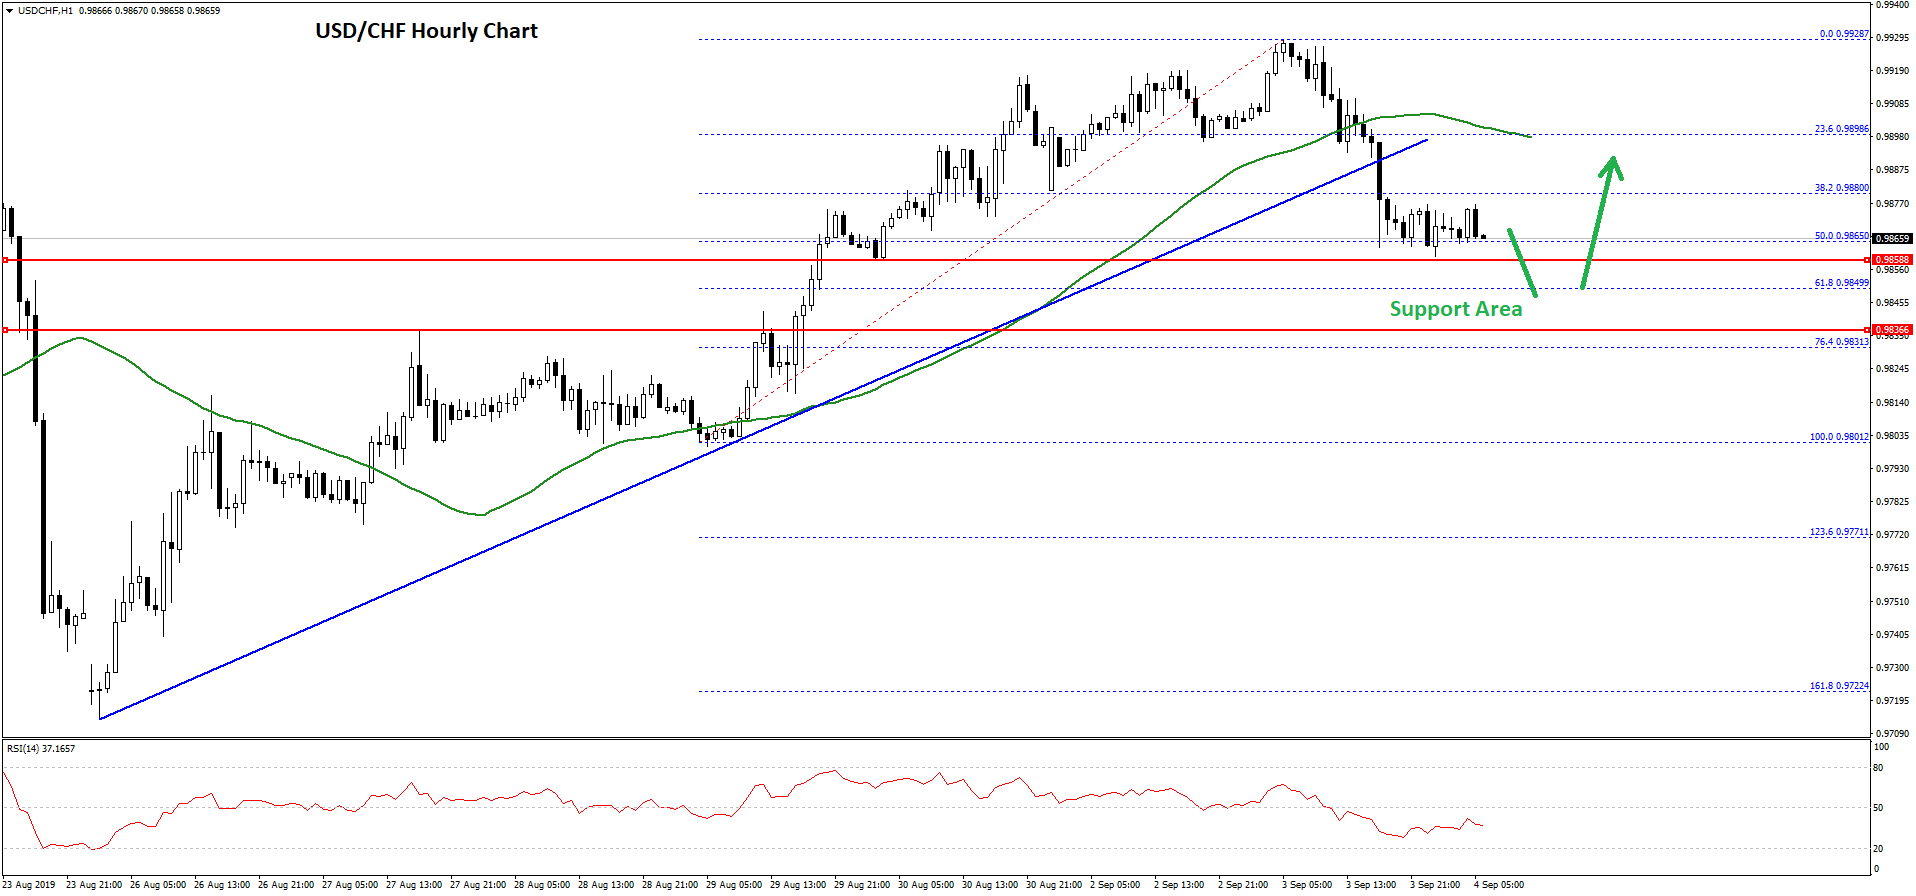
There was a break below the 0.9900 support and the 50 hourly simple moving average. Moreover, the pair traded below a key bullish trend line with support near 0.9890 on the hourly chart.
It is now trading near the 0.9860 support level and the 50% Fib retracement level of the upward move from the 0.9801 low to 0.9928 high. On the downside, there are many supports near the 0.9840 and 0.9820 levels.
Additionally, the 61.8% Fib retracement level of the upward move from the 0.9801 low to 0.9928 high is also near the 0.9849 to act as a support. Therefore, as long as the pair is trading above 0.9840, it is likely to bounce back.
On the upside, the key resistance is near the 0.9900 level and the 50 hourly SMA. A successful close above 0.9900 might push USD/CHF towards the 0.9940 and 0.9950 levels.
Trade over 50 forex markets 24 hours a day with FXOpen. Take advantage of low commissions, deep liquidity, and spreads from 0.0 pips (additional fees may apply). Open your FXOpen account now or learn more about trading forex with FXOpen.
This article represents the opinion of the Companies operating under the FXOpen brand only. It is not to be construed as an offer, solicitation, or recommendation with respect to products and services provided by the Companies operating under the FXOpen brand, nor is it to be considered financial advice.
Stay ahead of the market!
Subscribe now to our mailing list and receive the latest market news and insights delivered directly to your inbox.


Latest articles

Apple: Earnings Day Above the Activity Zone
On 30 April, after the market close, Apple Inc. will release its financial results for the second quarter of fiscal 2026. The consensus forecast, based on estimates from 31 analysts, points to revenue of around $109.7 billion, with expected

USD/JPY and USD/CHF Near Key Levels: The Dollar Supported by the Fed
The US dollar continues to trend upwards following the Federal Reserve meeting, drawing support from the regulator’s moderately hawkish stance and comments by Jerome Powell. Markets interpret the Fed’s rhetoric as a signal that restrictive policy is likely

EUR/USD and GBP/USD consolidate ahead of the Fed decision
European currencies are showing subdued dynamics, entering a consolidation phase following their previous advance. Earlier, EUR/USD and GBP/USD broke out of their ranges and strengthened; however, the subsequent correction has led both pairs to retest the previously breached