


EUR/USD Tumbles and USD/CHF Approaching Key Resistance
FXOpen
EUR/USD declined heavily and broke the 1.1400 and 1.1350 supports. On the other hand, USD/CHF moved higher and is currently approaching an important resistance near 0.9980.
Important Takeaways for EUR/USD and USD/CHF
- The Euro tumbled and settled below the 1.1450 pivot level against the US Dollar.
- A crucial bearish trend line is in place with resistance at 1.1370 on the hourly chart of EUR/USD.
- USD/CHF settled above the 0.9940 resistance and the 50 hourly simple moving average.
- There is a significant resistance and a bearish trend line at 0.9980 on the hourly chart.
EUR/USD Technical Analysis
The Euro started a significant downtrend from well above the 1.1600 level against the US Dollar. The EUR/USD pair tumbled and broke many important supports like 1.1540, 1.1500, 1.1450 and 1.1400.
The pair settled below the 1.1450 pivot level and the 50 hourly simple moving average, opening the doors for more losses. An intermediate low was formed at 1.1370 from where the pair corrected higher.
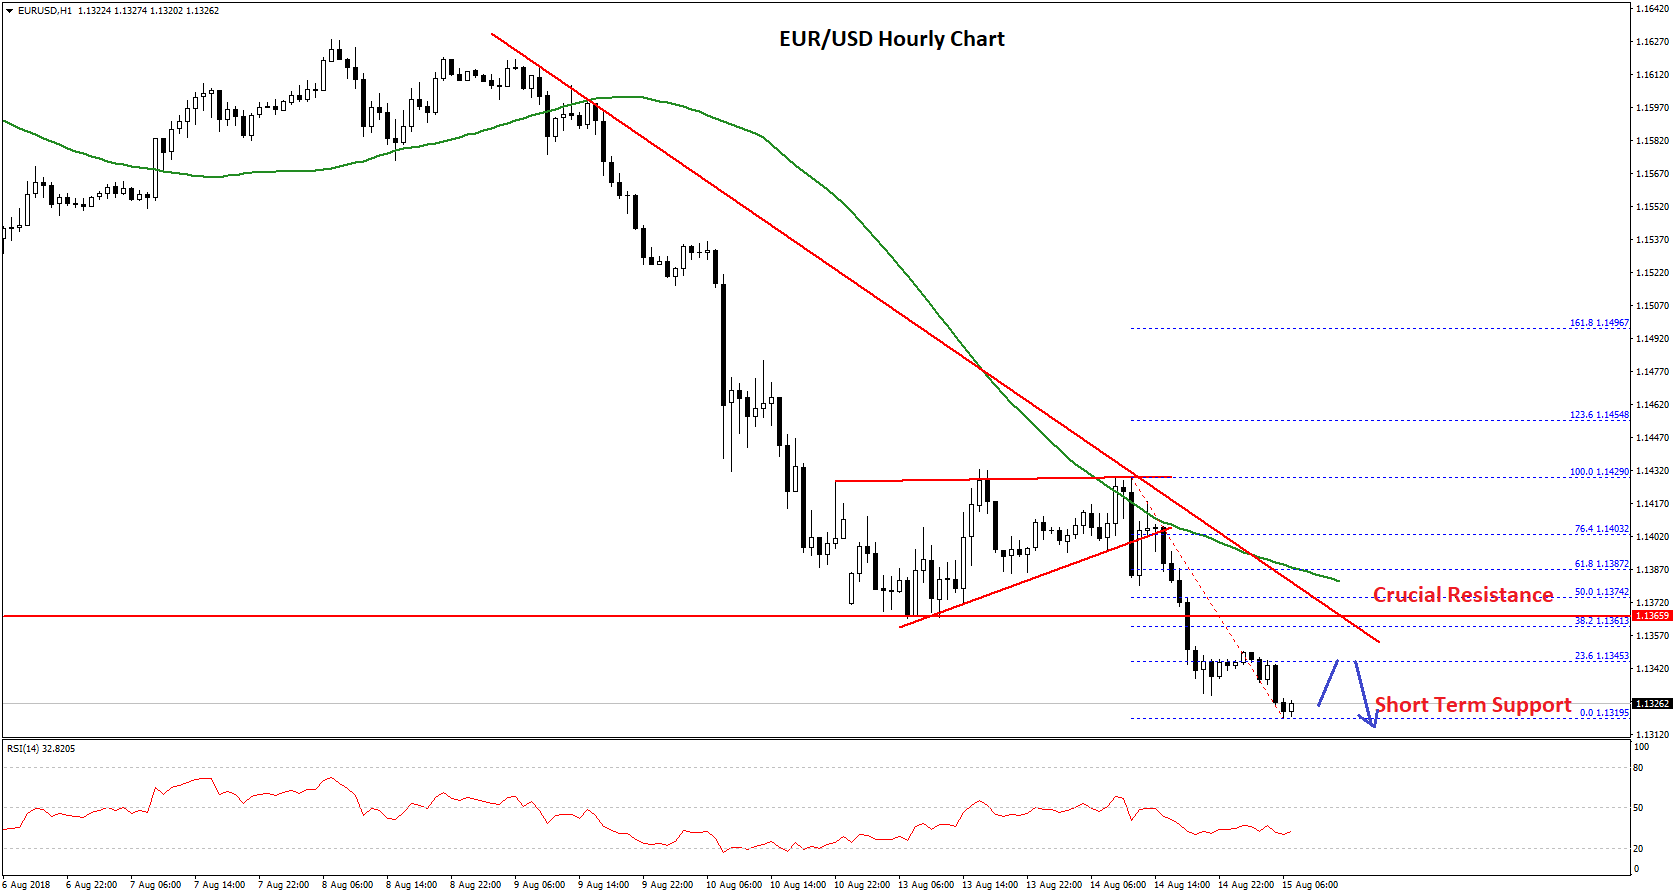
However, the upside move was capped by the 1.1430-40 zone and a crucial bearish trend line with current resistance at 1.1370 on the hourly chart of EUR/USD. The pair failed and started a fresh downside move below 1.1400.
It declined and broke the last swing low at 1.1370. It even broke the 1.1350 level and recently traded to a new monthly low at 1.1319. It is currently consolidating losses with an initial resistance near the 23.6% Fib retracement level of the last slide from the 1.1429 high to 1.1319 low.
On the upside, there are many resistances near the 1.1360-70 zone. Moreover, the 50% Fib retracement level of the last slide from the 1.1429 high to 1.1319 low is placed near 1.1375 along with the 50 hourly SMA.
Therefore, if the pair corrects higher, it is likely to face sellers near the 1.1360, 1.1375 and 1.1380 resistance levels. Above this last, the pair could face a crucial barrier at 1.1400.
On the downside, the 1.1320 level is a short-term support, below which, the pair may perhaps trade below the 1.1300 level in the near term.
USD/CHF Technical Analysis
The US Dollar formed a decent support near the 0.9900 level against the Swiss franc. The USD/CHF pair started an upward move and traded above the 0.9920 and 0.9940 resistance levels.
The pair even settled above the 0.9950 level and the 50 hourly SMA. During the upside move, the pair broke the last swing high at 0.9944 and a connecting bearish trend line with resistance at 0.9942 on the hourly chart.
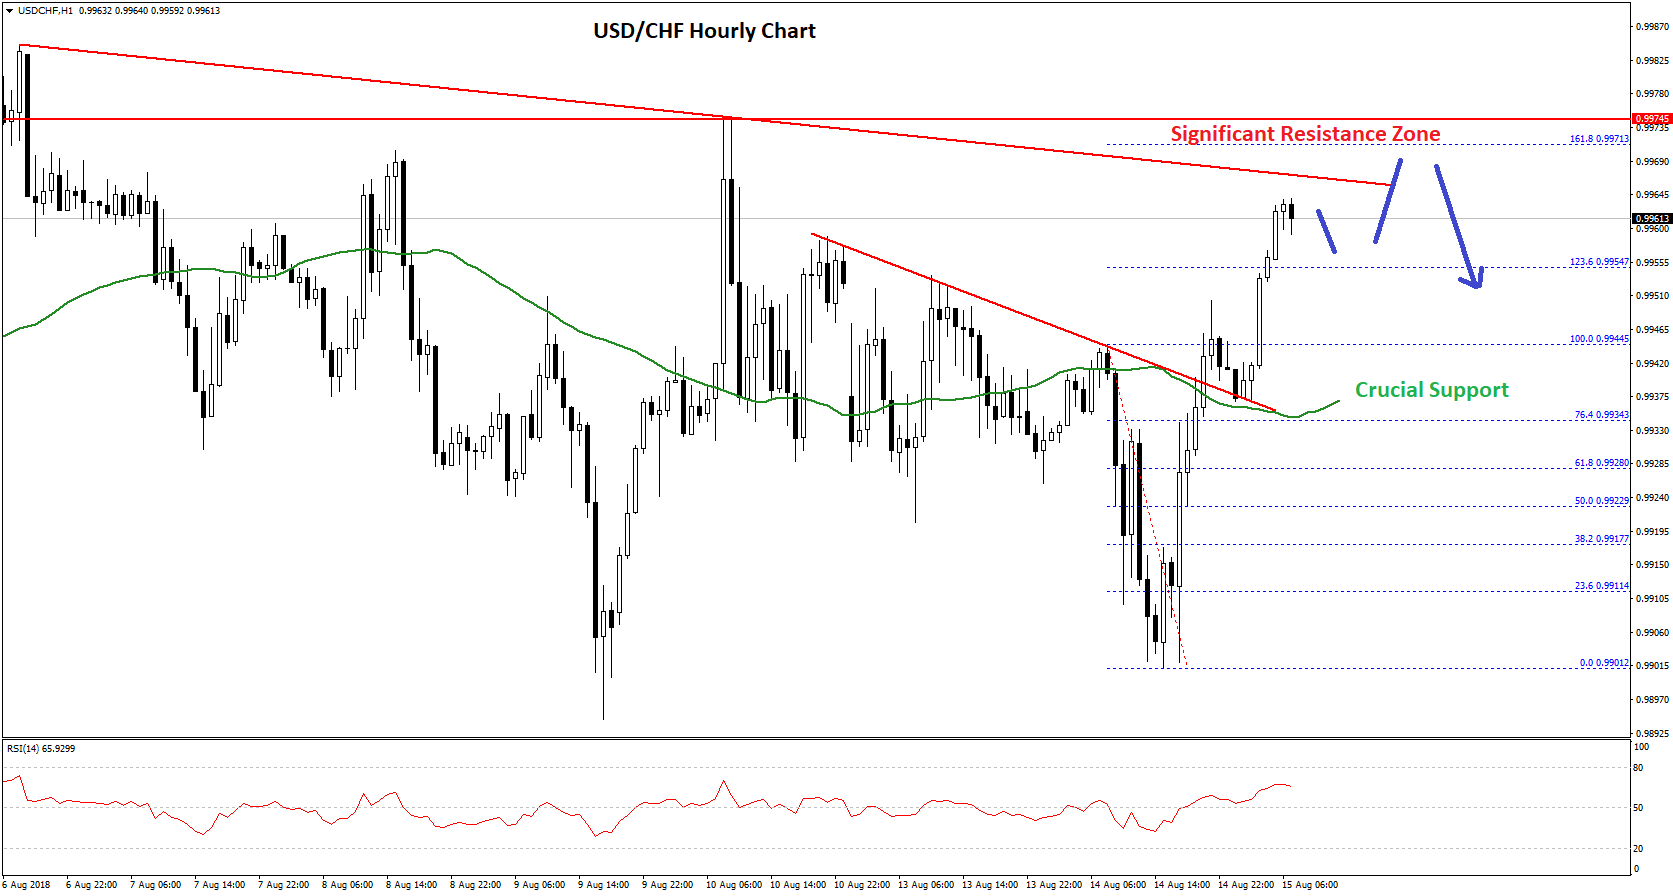
Buyers even pushed the pair above the 1.236 fib extension level of the last decline from the 0.9944 high to 0.9901 low. However, there is a crucial resistance waiting on the upside near the 0.9980 level.
A major bearish trend line and the 0.9971 swing high could prevent gains. Moreover, the 1.618 fib extension level of the last decline from the 0.9944 high to 0.9901 low is also near 0.9970.
Therefore, it won’t be easy for USD/CHF buyers to clear the 0.9970 and 0.9980 resistances. If they succeed, the pair will most likely attempt a break above the 1.0000 handle in the near term.
On the flip side, a downside correction could lead the pair towards the 0.9940 support zone, which was a resistance earlier and it might now act as a buy zone.
Trade over 50 forex markets 24 hours a day with FXOpen. Take advantage of low commissions, deep liquidity, and spreads from 0.0 pips (additional fees may apply). Open your FXOpen account now or learn more about trading forex with FXOpen.
This article represents the opinion of the Companies operating under the FXOpen brand only. It is not to be construed as an offer, solicitation, or recommendation with respect to products and services provided by the Companies operating under the FXOpen brand, nor is it to be considered financial advice.
Stay ahead of the market!
Subscribe now to our mailing list and receive the latest market news and insights delivered directly to your inbox.


Latest articles

Amazon Earnings: Does the Chart Already Know Something the Numbers Don't?
All eyes are on July 30, when Amazon reports Q2 2026 earnings, with Wall Street increasingly convinced the bar has been set too low. Consensus sees EPS near $1.82-$2.26 on roughly $197 billion in revenue, but the

WTI Analysis: Gap Breaks Short-Term Trend as Price Remains Trapped Between the POC and Profile Boundary
WTI crude oil plunged by more than 7% on 27 July 2026 after the US suspended a series of strikes against Iran over the weekend, raising hopes of a diplomatic solution and the reopening of shipping through the Strait of

US Dollar Index: A Defining Week for the King of the Markets
The dollar heads into a pivotal week trading near 101.80, just off a 15-month high, with the Fed's July 29 meeting standing as the clear focal point. Markets currently price roughly a 65% chance of a hold, though renewed