


EUR/USD Turns Green, USD/JPY Stuck In Crucial Range
FXOpen

EUR/USD started a fresh increase above the 1.0900 and 1.0920 resistance levels. USD/JPY is currently trading in a crucial range above the key 107.35 support zone.
Important Takeaways for EUR/USD and USD/JPY
- The Euro started a steady rise from the 1.0870 low and settled above 1.0920.
- There is a key bullish trend line forming with support near 1.0945 on the hourly chart of EUR/USD.
- USD/JPY is facing a lot of hurdles on the upside near the 107.90 and 108.00 levels.
- There is a short term declining channel forming with resistance near 107.55 on the hourly chart.
EUR/USD Technical Analysis
This week, the Euro started a steady increase from the 1.0870 swing low against the US Dollar. The EUR/USD pair broke the 1.0900 and 1.0920 resistance levels to enter a bullish zone.
Moreover, there was a close above the 1.0950 level and the 50 hourly simple moving average. The pair even climbed above the 1.0980 and traded as high as 1.0995 on FXOpen.
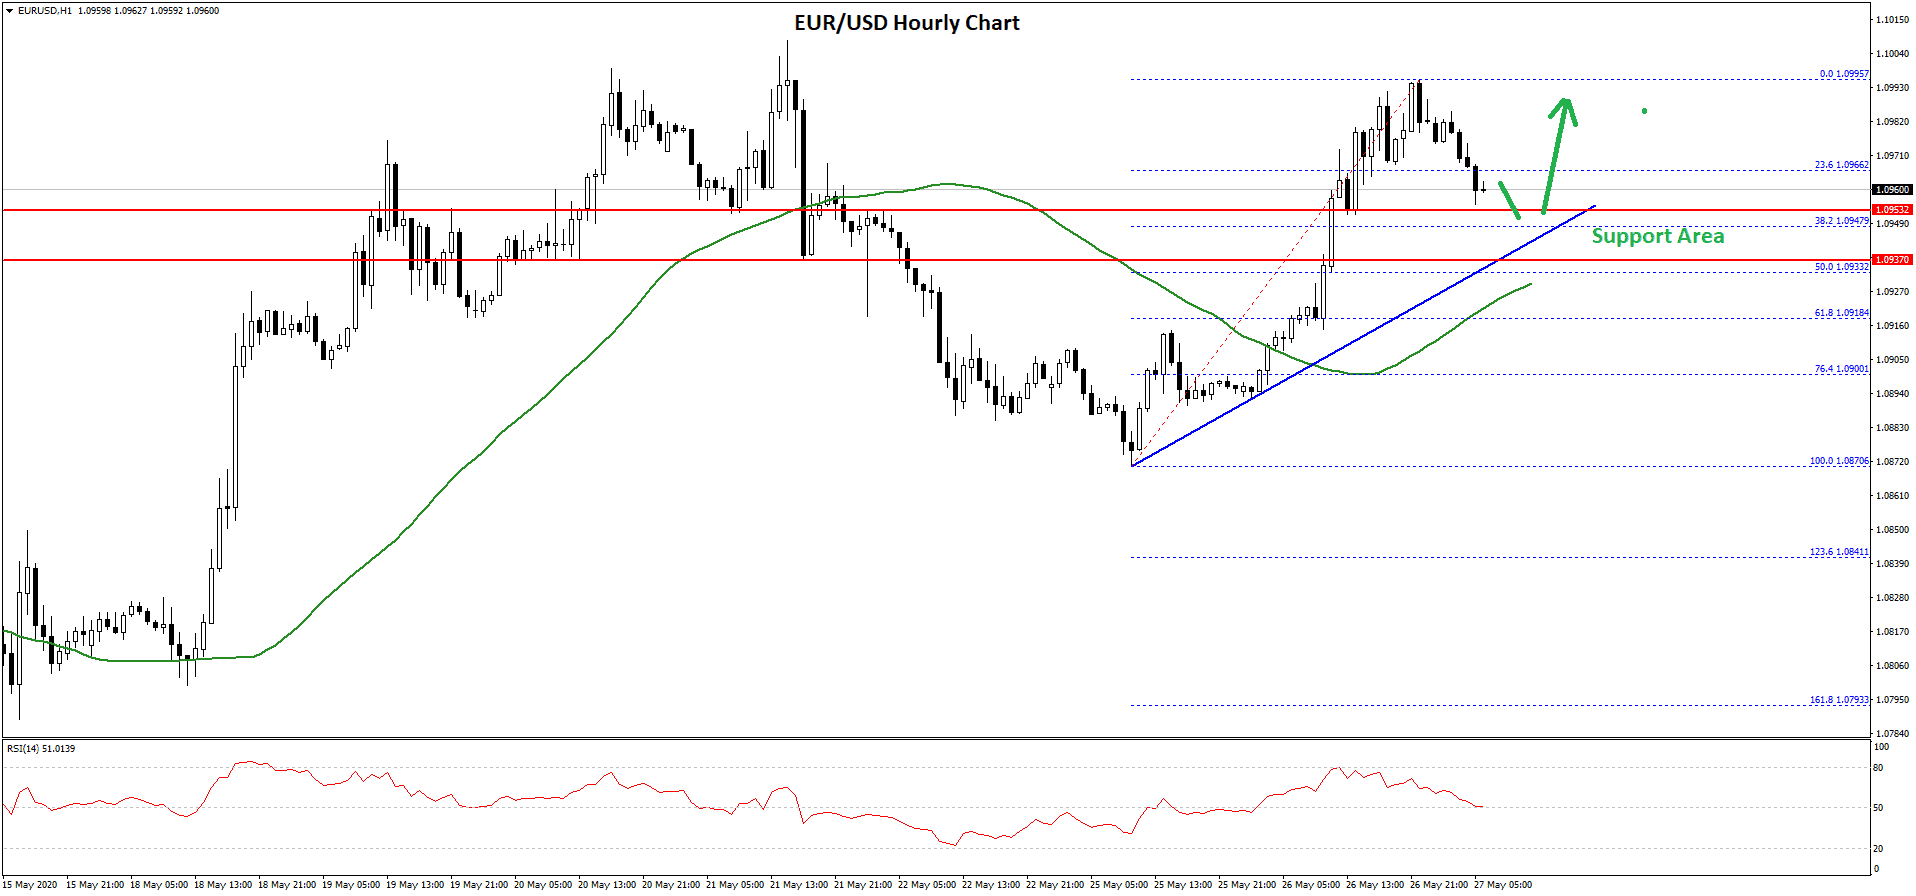
It is currently correcting lower and trading below the 23.6% Fib retracement level of the recent rise from the 1.0870 low to 1.0995 high. On the downside, there is a decent support forming near the 1.0950 level.
There is also a key bullish trend line forming with support near 1.0945 on the hourly chart of EUR/USD. Below the trend line, the 50% Fib retracement level of the recent rise from the 1.0870 low to 1.0995 high might provide support near 1.0935.
The next key support is near the 1.0930 level and the 50 hourly simple moving average. If the pair fails to stay above the 1.0950 and 1.0930 support levels, it is likely to resume its decline and continue lower towards the 1.0880 support.
Conversely, EUR/USD could start a fresh increase and trade above the 1.0980 resistance. The main resistance is near the 1.1000 level, above which the bulls are likely to aim a test of 1.1040 in the near term.
USD/JPY Technical Analysis
The US Dollar made a couple of attempts to clear the 108.00 resistance against the Japanese Yen. However, the USD/JPY pair failed to clear the 107.90 and 108.00 resistance levels.
As a result, there was a bearish reaction below the 107.80 level. The pair even broke the 107.60 level and settled below the 50 hourly simple moving average.
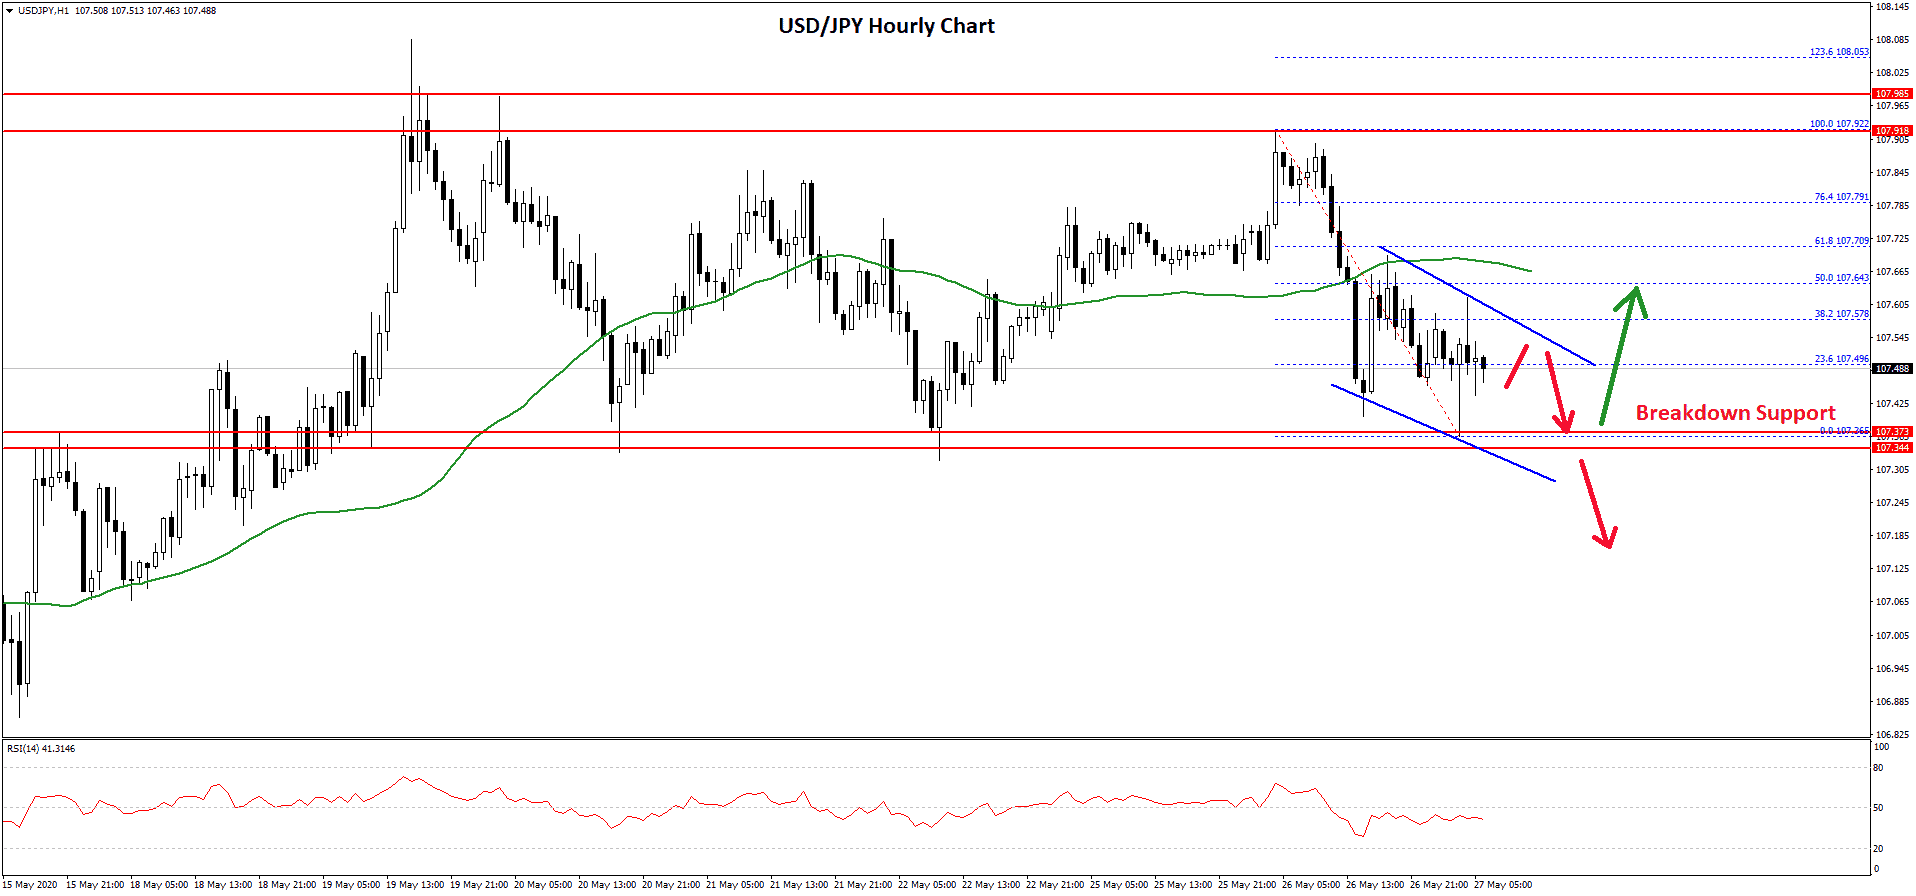
It tested the 107.35 support area, which has acted as a strong buy zone on many occasions recently. If the pair continues to move down and fails to stay above the 107.35 level, there is a risk of a sharp decline towards the 107.00 and 106.80 levels.
It is currently trading above the 23.6% Fib retracement level of the recent decline from the 107.92 high to 107.36 low. An initial resistance is near the 107.55 level. There is also a short term declining channel forming with resistance near 107.55 on the hourly chart.
If there is a break above the channel resistance, the pair could test the 107.65 level or the 50 hourly simple moving average. An intermediate resistance is near the 50% Fib retracement level of the recent decline from the 107.92 high to 107.36 low.
The main resistance on the upside is still near the 107.90 and 108.00 levels. If USD/JPY climbs above 108.00, it could surge towards 108.80 and 109.00.
Trade over 50 forex markets 24 hours a day with FXOpen. Take advantage of low commissions, deep liquidity, and spreads from 0.0 pips (additional fees may apply). Open your FXOpen account now or learn more about trading forex with FXOpen.
This article represents the opinion of the Companies operating under the FXOpen brand only. It is not to be construed as an offer, solicitation, or recommendation with respect to products and services provided by the Companies operating under the FXOpen brand, nor is it to be considered financial advice.
Stay ahead of the market!
Subscribe now to our mailing list and receive the latest market news and insights delivered directly to your inbox.


Latest articles

EUR/USD and GBP/USD consolidate ahead of the Fed decision
European currencies are showing subdued dynamics, entering a consolidation phase following their previous advance. Earlier, EUR/USD and GBP/USD broke out of their ranges and strengthened; however, the subsequent correction has led both pairs to retest the previously breached

Meta: V-Shaped Recovery Meets Heavy Volume Resistance
The movement in Meta Platforms shares is being driven by two competing narratives. On one hand, advertising revenue is benefiting from AI-based tools: the Advantage+ platform continues to support strong advertiser demand, and the analyst consensus for Q1 2026 revenue

Commodity Currencies Test Key Levels Ahead of Major Macro Data
Commodity-linked currencies are trading near key levels, showing restrained price action as market participants adopt a wait-and-see approach. The fundamental backdrop is shaped by expectations surrounding the release of Australia’s inflation data and the Bank of Canada’s interest