


EUR/USD Under Pressure, USD/CHF Approaching Key Support
FXOpen
EUR/USD struggled to stay above the 1.1200 level and recently declined below 1.1185. USD/CHF is currently correcting lower, but it seems to be approaching a key support near 1.0050.
Important Takeaways for EUR/USD and USD/CHF
- The Euro topped near the 1.1215 level and recently declined below 1.1200 against the US Dollar.
- There is a key bearish trend line forming with resistance near 1.1182 on the hourly chart of EUR/USD.
- USD/CHF failed to surpass the main 1.0100 resistance level and recently declined below 1.0080.
- There is a major bullish trend line forming with support near 1.0050 on the hourly chart.
EUR/USD Technical Analysis
The Euro started a strong rise from the 1.1107 swing low against the US Dollar. The EUR/USD pair climbed above the 1.1155 and 1.1200 resistance levels. However, the bulls failed to keep the pair above the 1.1200 level.
A swing high was formed at 1.1215 on FXOpen and the pair recently started a downside correction. It broke the 1.1200 and 1.1185 support levels to enter a short term bearish zone.
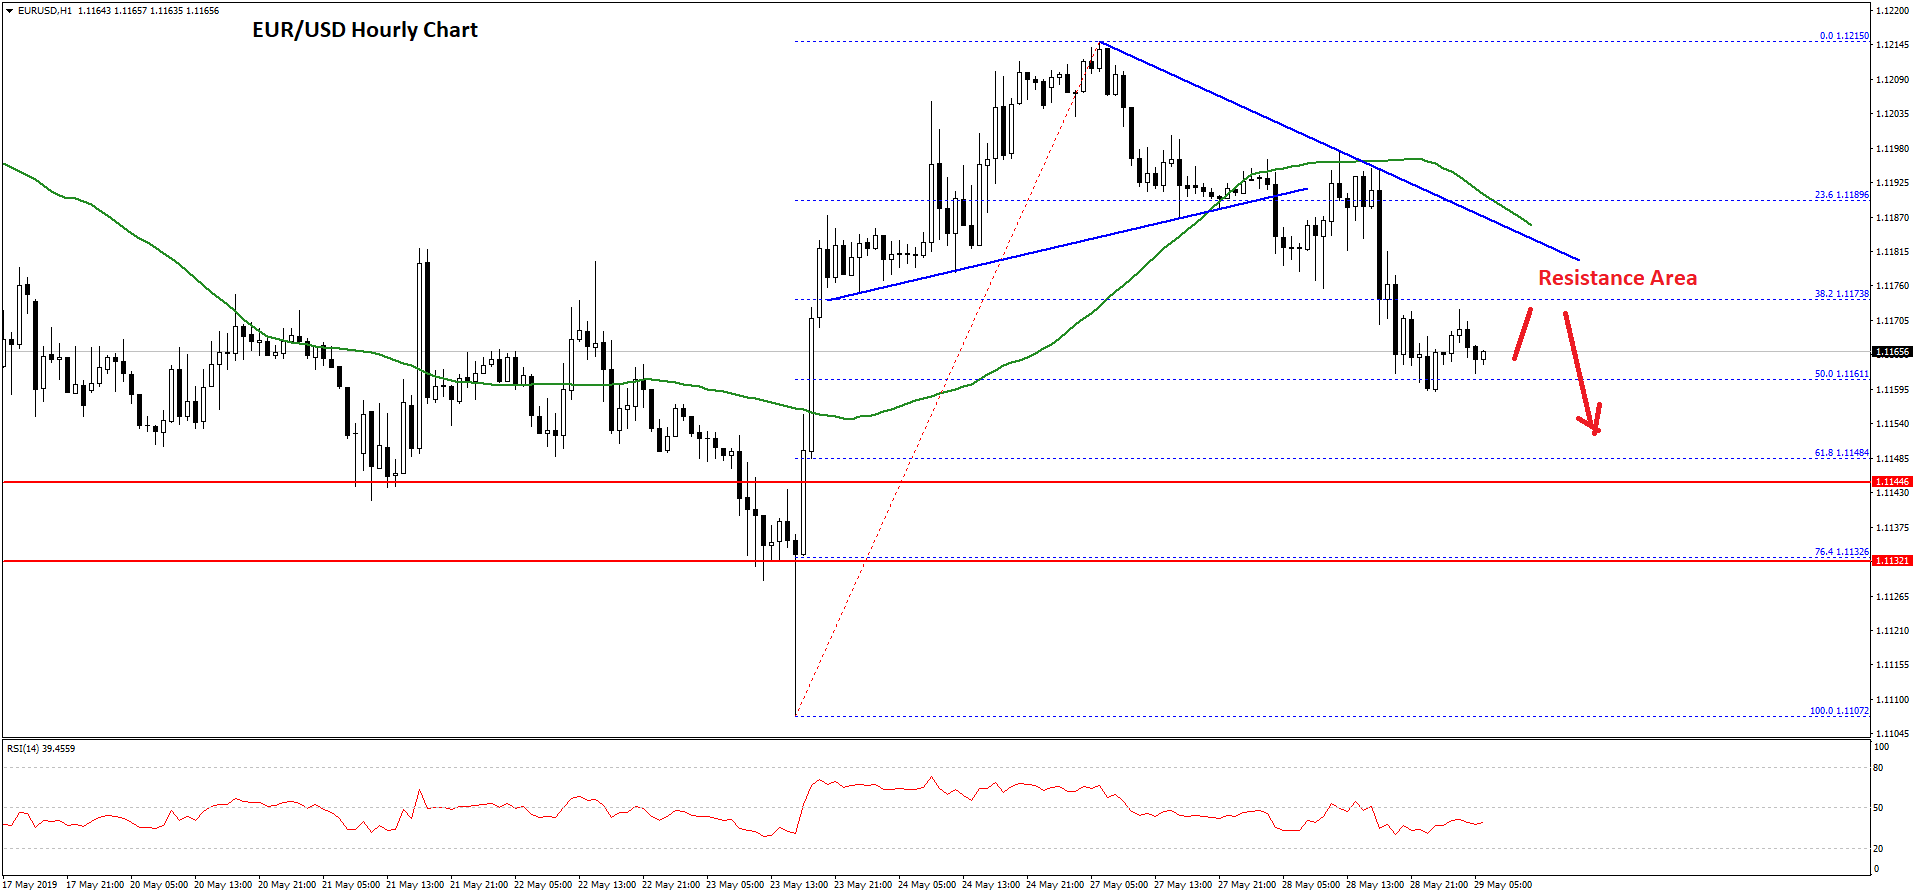
During the decline, the pair settled below the 1.1185 level and the 50 hourly simple moving average. Moreover, there was a break below a connecting bullish trend line with support at 1.1188 on the hourly chart.
The pair is currently testing the 50% Fib retracement level of the last wave from the 1.1107 low to 1.1215 high. On the downside, the main support is near the 1.1148 and 1.1145 levels.
The 61.8% Fib retracement level of the last wave from the 1.1107 low to 1.1215 high is also near the 1.1148 level. On the upside, there is a strong resistance forming near the 1.1180 and 1.1185 levels.
There is also a key bearish trend line forming with resistance near 1.1182 on the hourly chart of EUR/USD. Therefore, a short term recovery is likely to face a strong selling interest near the 1.1185 level. The next important resistance for the bulls is near the 1.1200 level.
USD/CHF Technical Analysis
The US Dollar started a decent upward move from the 1.0000 support area against the Swiss franc. The USD/CHF pair broke the 1.0040 and 1.0060 resistance levels, and traded close to the 1.0100 resistance.
However, the pair struggled to surpass the 1.0100 resistance and topped near the 1.0097 level. It started a downside correction and traded below the 50% Fib retracement level of the last wave from the 1.0034 low to 1.0097 high.
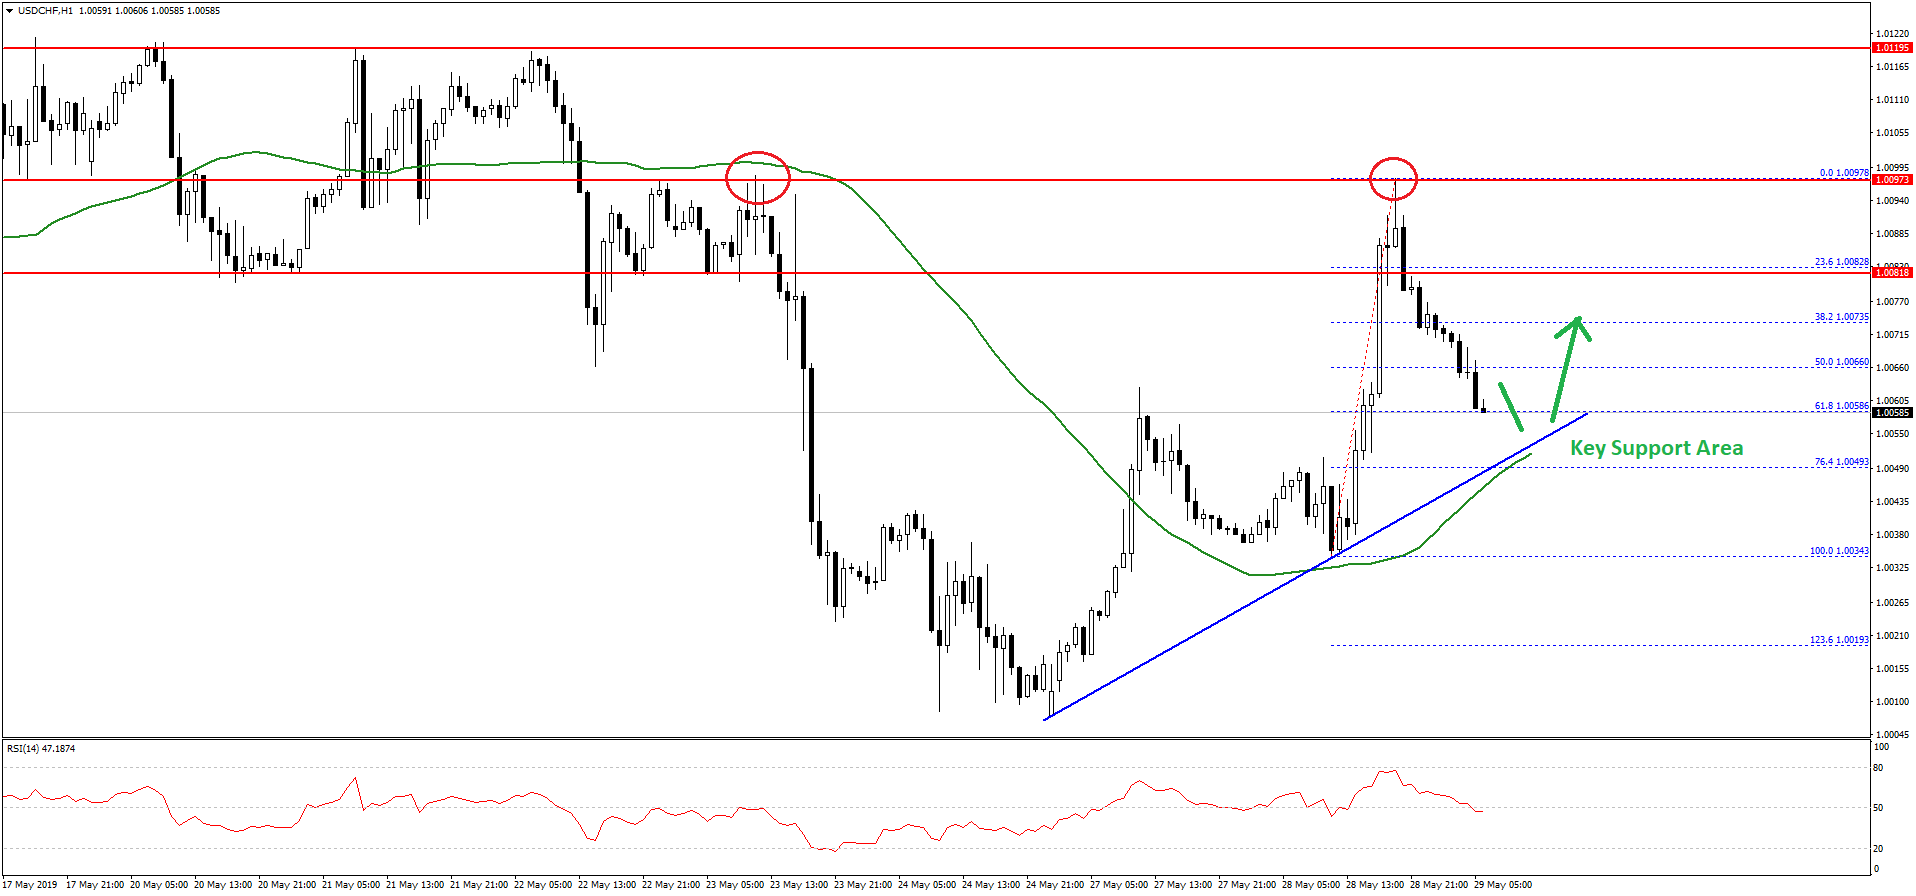
At the moment, the pair is testing the 1.0060 support area and the 61.8% Fib retracement level of the last wave from the 1.0034 low to 1.0097 high.
More importantly, there is a major bullish trend line forming with support near 1.0050 on the hourly chart. Therefore, the pair is likely to find a strong buying interest near the 1.0050 level.
If there is a downside break below the trend line, 1.0050, and the 50 hourly simple moving average, the pair could extend its decline towards the 1.0020 level.
On the upside, an initial resistance is near the 1.0075 level, above which USD/CHF could revisit the key 1.0100 resistance area in the near term. The next important resistances are 1.0120 and 1.0125. Overall, dips remains supported as long as the pair is above 1.0050.
Trade over 50 forex markets 24 hours a day with FXOpen. Take advantage of low commissions, deep liquidity, and spreads from 0.0 pips (additional fees may apply). Open your FXOpen account now or learn more about trading forex with FXOpen.
This article represents the opinion of the Companies operating under the FXOpen brand only. It is not to be construed as an offer, solicitation, or recommendation with respect to products and services provided by the Companies operating under the FXOpen brand, nor is it to be considered financial advice.
Stay ahead of the market!
Subscribe now to our mailing list and receive the latest market news and insights delivered directly to your inbox.


Latest articles

USD/JPY and USD/CHF Near Key Levels: The Dollar Supported by the Fed
The US dollar continues to trend upwards following the Federal Reserve meeting, drawing support from the regulator’s moderately hawkish stance and comments by Jerome Powell. Markets interpret the Fed’s rhetoric as a signal that restrictive policy is likely

EUR/USD and GBP/USD consolidate ahead of the Fed decision
European currencies are showing subdued dynamics, entering a consolidation phase following their previous advance. Earlier, EUR/USD and GBP/USD broke out of their ranges and strengthened; however, the subsequent correction has led both pairs to retest the previously breached

Meta: V-Shaped Recovery Meets Heavy Volume Resistance
The movement in Meta Platforms shares is being driven by two competing narratives. On one hand, advertising revenue is benefiting from AI-based tools: the Advantage+ platform continues to support strong advertiser demand, and the analyst consensus for Q1 2026 revenue