


EUR/JPY and GBP/JPY Monthly Outlook - Jun 2018
FXOpen
The Euro and British Pound are trading in a bearish zone against the Japanese Yen. Both EUR/JPY and GBP/JPY have formed similar patterns on the daily chart are both are approaching important resistances.
Important Takeaways for EUR/JPY and GBP/JPY
- The Euro has recovered well from the 124.54 low against the Japanese Yen.
- There is a major bearish trend line with resistance at 130.50 on the daily chart of EUR/JPY.
- GBP/JPY also bounced back after forming support at 143.20.
- A major barrier awaits on the upside near 149.40 and the 50-day SMA.
EUR/JPY Technical Analysis
The Euro declined sharply from the 133.48 swing high in May 2018 against the Japanese Yen. The EUR/JPY pair tumbled and broke the 130.00 and 129.00 support levels.
The decline was such that the pair moved well below the 130.00 handle and the 50-day simple moving average. It even moved a few pips below 125.00 before finding buyers near the 124.50 level during late May 2018.
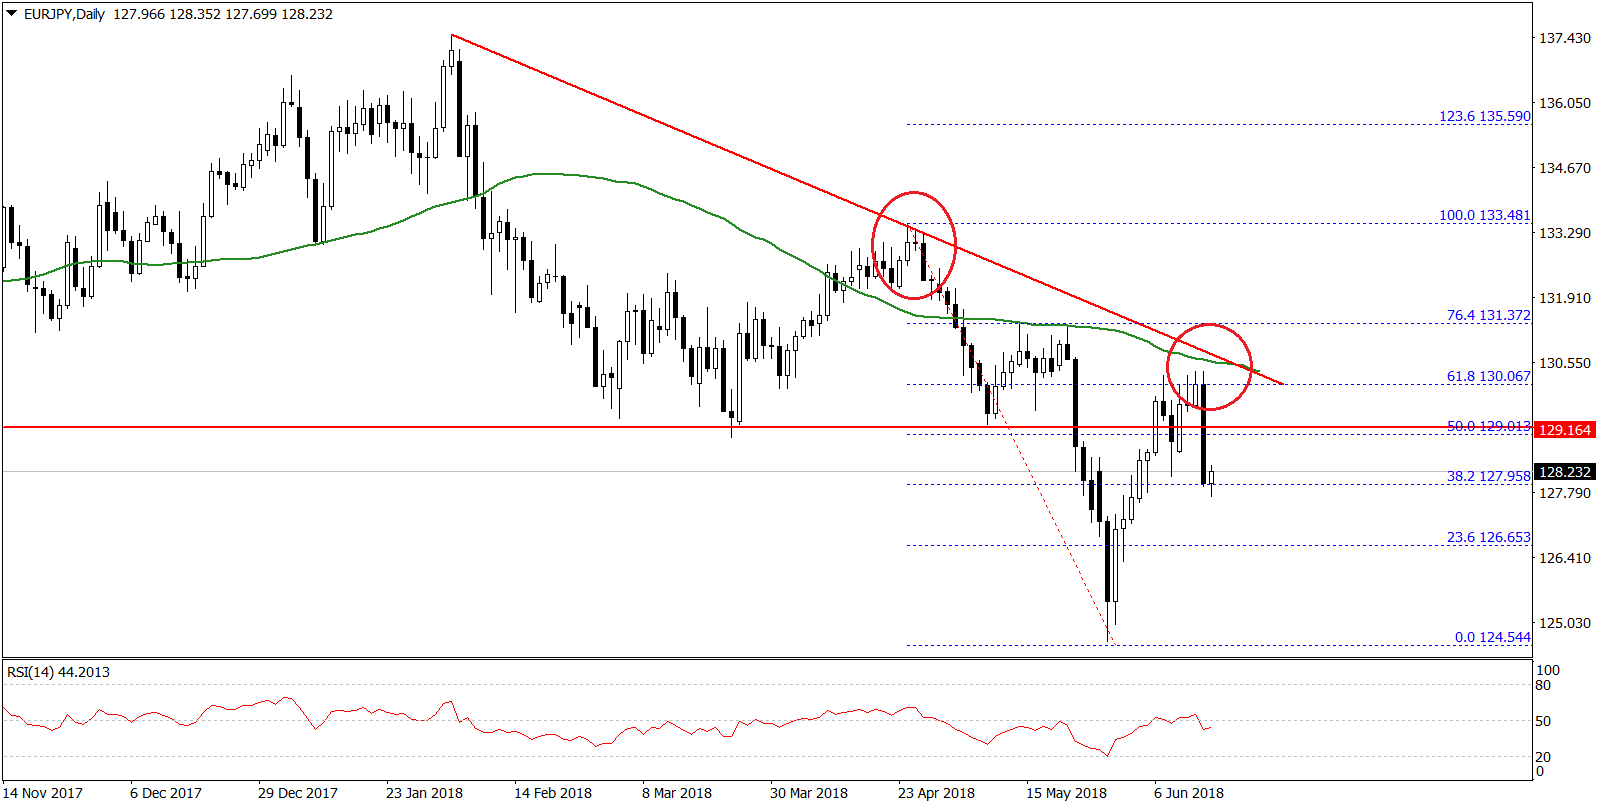
The pair recovered nicely and moved above the 125.00 and 126.00 levels. There was even a break above the 38.2% Fib retracement level of the last decline from the 133.48 high to 124.54 low.
However, the pair is still in a bearish zone (considering medium term trend) since it is well below the 130.00 handle and the 50-day SMA. Moreover, there is a major bearish trend line with resistance at 130.50 on the daily chart of EUR/JPY.
Therefore, a proper close above 130.00 and 50-day SMA is needed for a change in trend. On the downside, supports are seen at 126.50 and 125.00.
Overall, the pair may continue to move higher this month, but it won’t be easy for buyers to surpass the 130.00/50 resistance zone.
GBP/JPY Technical Analysis
The British Pound also followed a similar pattern and declined heavily from the 153.80 level in May 2018 against the Japanese Yen. The GBP/JPY pair broke the 150.00 and 148.50 support levels to move into a bearish zone.
It even cracked the 145.00 support and settled below the 50-day SMA. It traded as low as 143.19 before forming a support base for an upside move. It corrected higher and traded above the 23.6% Fib retracement level of the last decline from the 153.85 high to 143.19 low.
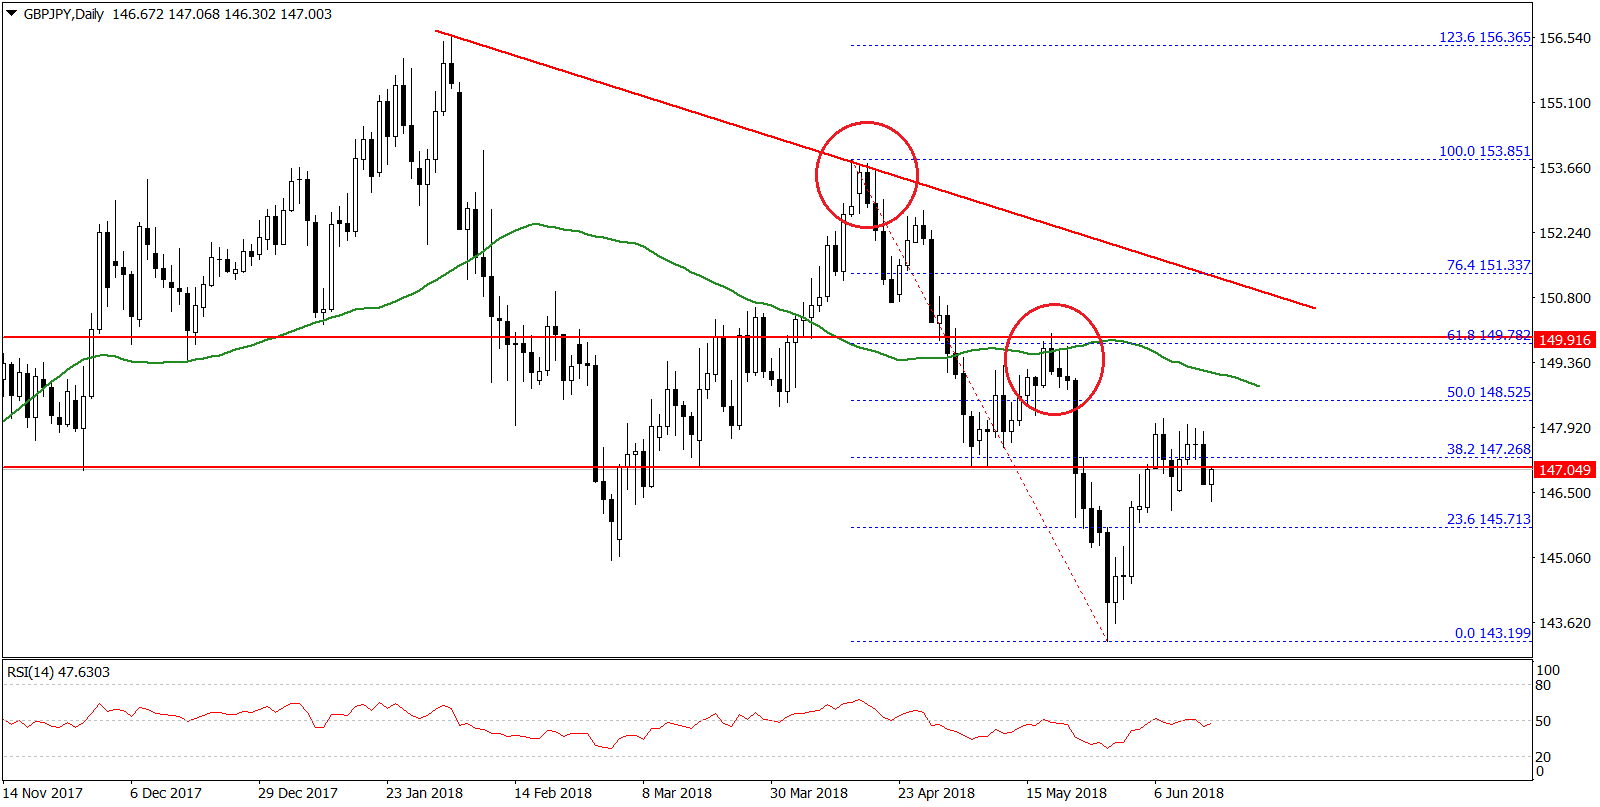
However, there are many barriers on the upside, including 147.20, 148.50 and a key bearish trend line with resistance at 150.80 on the daily chart. The most important one is 148.50 since it coincides with the 50% Fib retracement level of the last decline from the 153.85 high to 143.19 low.
Considering the current trend, the pair may perhaps correct further higher, but it will most likely struggle to break the 148.50 resistance zone. On the downside, supports are seen near 145.00 and 143.50.
Trade over 50 forex markets 24 hours a day with FXOpen. Take advantage of low commissions, deep liquidity, and spreads from 0.0 pips (additional fees may apply). Open your FXOpen account now or learn more about trading forex with FXOpen.
This article represents the opinion of the Companies operating under the FXOpen brand only. It is not to be construed as an offer, solicitation, or recommendation with respect to products and services provided by the Companies operating under the FXOpen brand, nor is it to be considered financial advice.
Stay ahead of the market!
Subscribe now to our mailing list and receive the latest market news and insights delivered directly to your inbox.


Latest articles

Pound at Key Levels: Markets Assess Impact of Political Uncertainty in the UK
The British pound remains under pressure following increased political uncertainty in the United Kingdom triggered by the Prime Minister’s resignation. Investors are assessing potential shifts in the political and economic policy outlook after the head of government stepped down,

Silver: Fed Tightens Its Tone as Price Returns to the Volume Profile Zone
Silver came under pressure following the Federal Reserve’s June meeting, at which policymakers kept interest rates unchanged at 3.50–3.75%. Nine of the 18 committee members still see the possibility of a rate increase this year, reinforcing

Ethereum: Market Assesses the Strength of the Corrective Recovery
Following a period of heightened volatility in early June, investor attention in Ethereum has once again shifted towards institutional demand and the development of the spot ETF market in the United States. The funds launched last year continue to serve