


EUR/JPY Plunges on Japan Data
FXOpen
The Euro takes a reverse move against the Japanese yen on Friday, dragging the price of EUR/JPY to less than 146.97 ahead of Japanese industrial production figure. The week was started with the pair reaching the 5-year high but it is then restricted by the strong Japanese data and went through bearish breakout.
Technical Analysis
As of this writing, the pair is being traded around 147.08. Opened at 147.24, the pair moved higher taking the price to 147.72 but overwhelmed by the bearish pressure, it moved down and is now trading around 147.10 handle.
On the downside, a major support can be seen around 146.40, the psychological number and the level that has been supporting the pair since 19th November. Success in breaking this level would make the pair to test the next support that lies around 143.78, the 38.2% Fib level of the last drop. This breakout if takes place will open the way to 142.00 handle, the psychological number and the confluence of 50% Fib level and 50-Day SMA. Consequently, the pair may further move down to test the 140.00 handle, the psychological number and the confluence of 100-Day and 200-Day SMA, as demonstrated in the following chart.
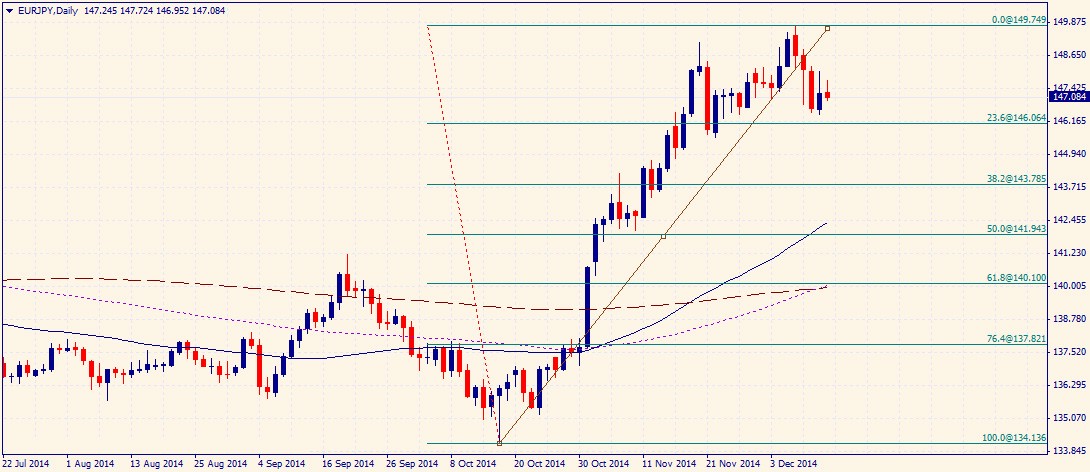
On the upside, a resistance can be noted around 148.21 and 148.85 consecutively. Success in breaking these levels will let the pair to test the resistance at 149.78, thereby printing a fresh yearly high.
The long-term bias is bullish because of higher highs on the daily chart. The bias will remain bullish as far as the support area around 140.00 is intact.
Industrial Production (YoY)
Released by the Eurostat, the industrial production remained at 0.6% same as that in the same month of the previous year, says the median projection of different analysts. Generally speaking, a high reading carries positive sentiment and is therefore bullish for the Euro and vice versa. Thus a better than expected figure may spur a buying pressure in the price of EUR/JPY.
Industrial Production of Japan (YoY)
As released today, the Japanese industrial production is marked at -0.8% far below then 0.8% in the same month of the year before. Generally speaking a high reading is considered positive for the Japanese yen and vice versa. Thus the worse outcome is expected to prove bullish for the EUR/JPY.
Trade Idea
Considering the overall fundamental and technical outlook, selling around the current levels appears to be a good strategy in short to medium term.
Trade over 50 forex markets 24 hours a day with FXOpen. Take advantage of low commissions, deep liquidity, and spreads from 0.0 pips (additional fees may apply). Open your FXOpen account now or learn more about trading forex with FXOpen.
This article represents the opinion of the Companies operating under the FXOpen brand only. It is not to be construed as an offer, solicitation, or recommendation with respect to products and services provided by the Companies operating under the FXOpen brand, nor is it to be considered financial advice.
Stay ahead of the market!
Subscribe now to our mailing list and receive the latest market news and insights delivered directly to your inbox.


Latest articles

USD/JPY and USD/CHF Near Key Levels: The Dollar Supported by the Fed
The US dollar continues to trend upwards following the Federal Reserve meeting, drawing support from the regulator’s moderately hawkish stance and comments by Jerome Powell. Markets interpret the Fed’s rhetoric as a signal that restrictive policy is likely

EUR/USD and GBP/USD consolidate ahead of the Fed decision
European currencies are showing subdued dynamics, entering a consolidation phase following their previous advance. Earlier, EUR/USD and GBP/USD broke out of their ranges and strengthened; however, the subsequent correction has led both pairs to retest the previously breached

Meta: V-Shaped Recovery Meets Heavy Volume Resistance
The movement in Meta Platforms shares is being driven by two competing narratives. On one hand, advertising revenue is benefiting from AI-based tools: the Advantage+ platform continues to support strong advertiser demand, and the analyst consensus for Q1 2026 revenue