


EUR/USD and EUR/CHF Technical Analysis
FXOpen

EUR/USD
- EUR/USD moving inside minor impulse wave 5
- Further gains likely toward 1.2500
EUR/USD has been rising in the last few trading sessions inside the sharp minor impulse wave 5, which belongs to the strong medium-term impulse wave (C) from the start of November. The active impulse wave 5 started when the pair reversed up with the daily Japanese candlesticks reversal pattern Bullish Engulfing (encircled below) from the combined support area lying at the intersection of the multiple intersecting support levels: the 50-day moving average, support trendline of the daily up channel from October, lower daily Bollinger Band and the 38.2% Fibonacci retracement of the previous upward impulse from November.
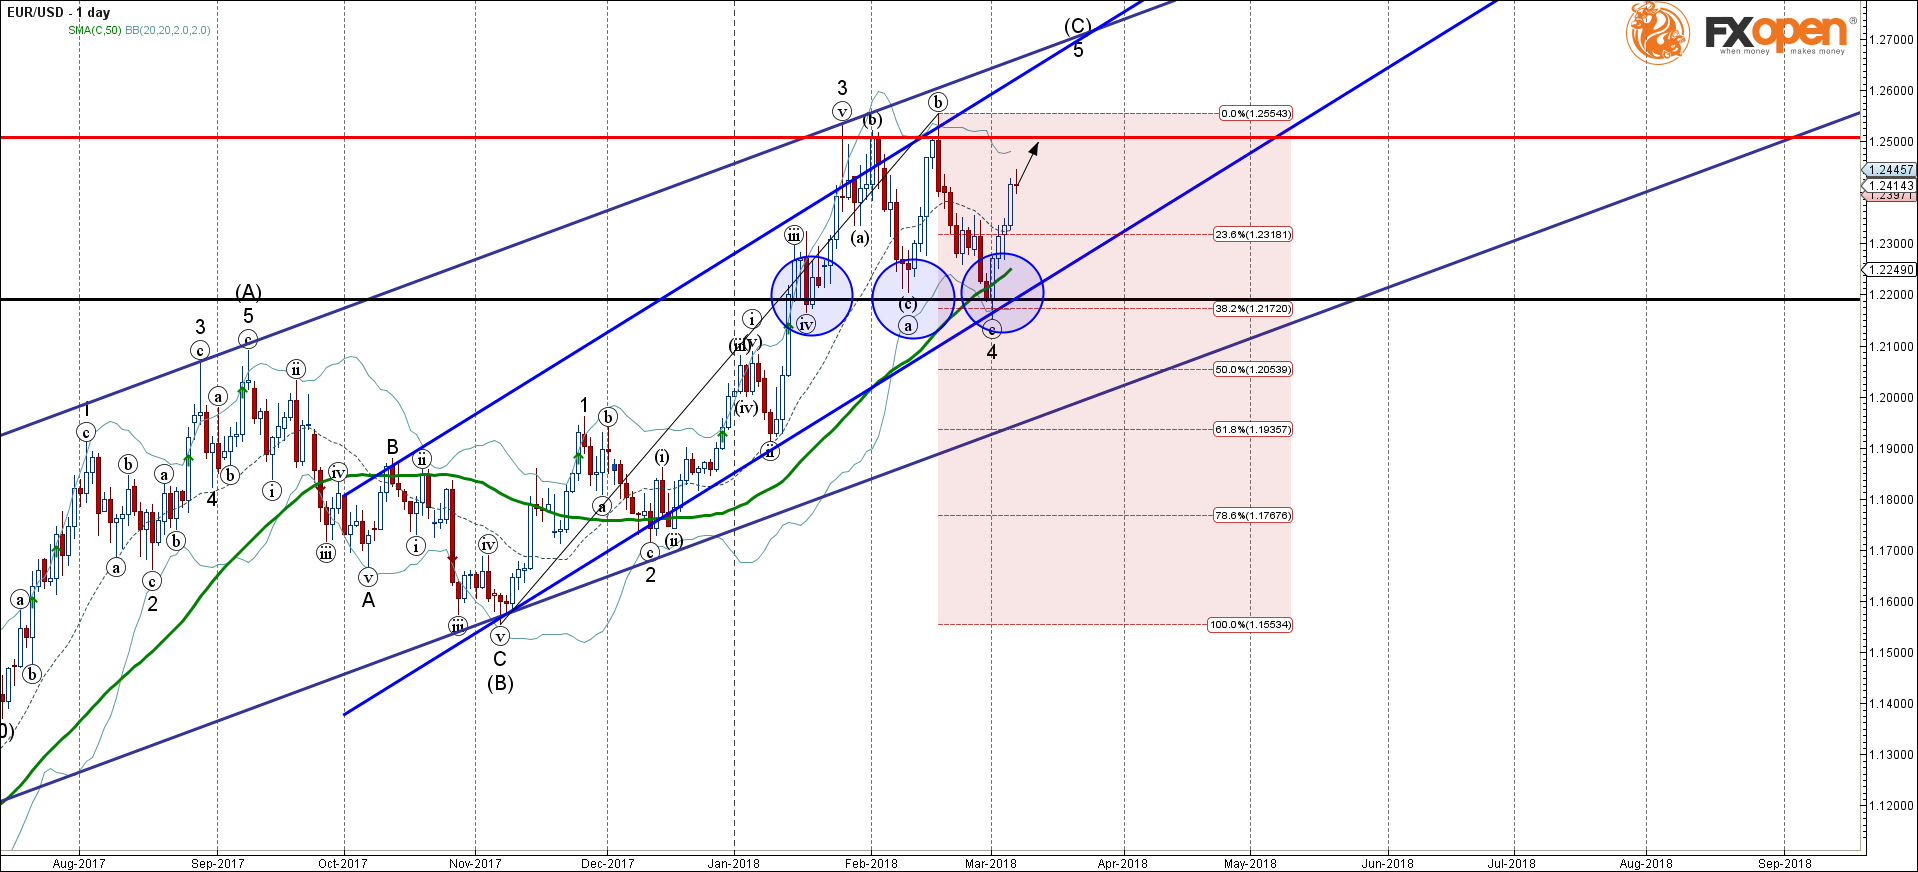
EUR/USD is expected to continue the upward movement toward the next buy target at the next prominent resistance level 1.2500 (which reversed the earlier waves 3, (b) and b).
EUR/CHF
- EUR/CHF broke resistance area
- Next buy target – 1.1800
EUR/CHF continues to rise inside the accelerated medium-term impulse wave (3) – which earlier broke through the resistance area lying at the intersection of the pivotal resistance level 1.6000 (former strong support from November and December, which reversed the previous (B)-wave at the start of February, as can be seen from the daily EUR/CHF chart below) and the 38.2% Fibonacci correction of the previous major ABC correction ② from the middle of January. The breakout of this the resistance area strengthened the bullish pressure on this currency pair – which is indicated by the rising daily Momentum.
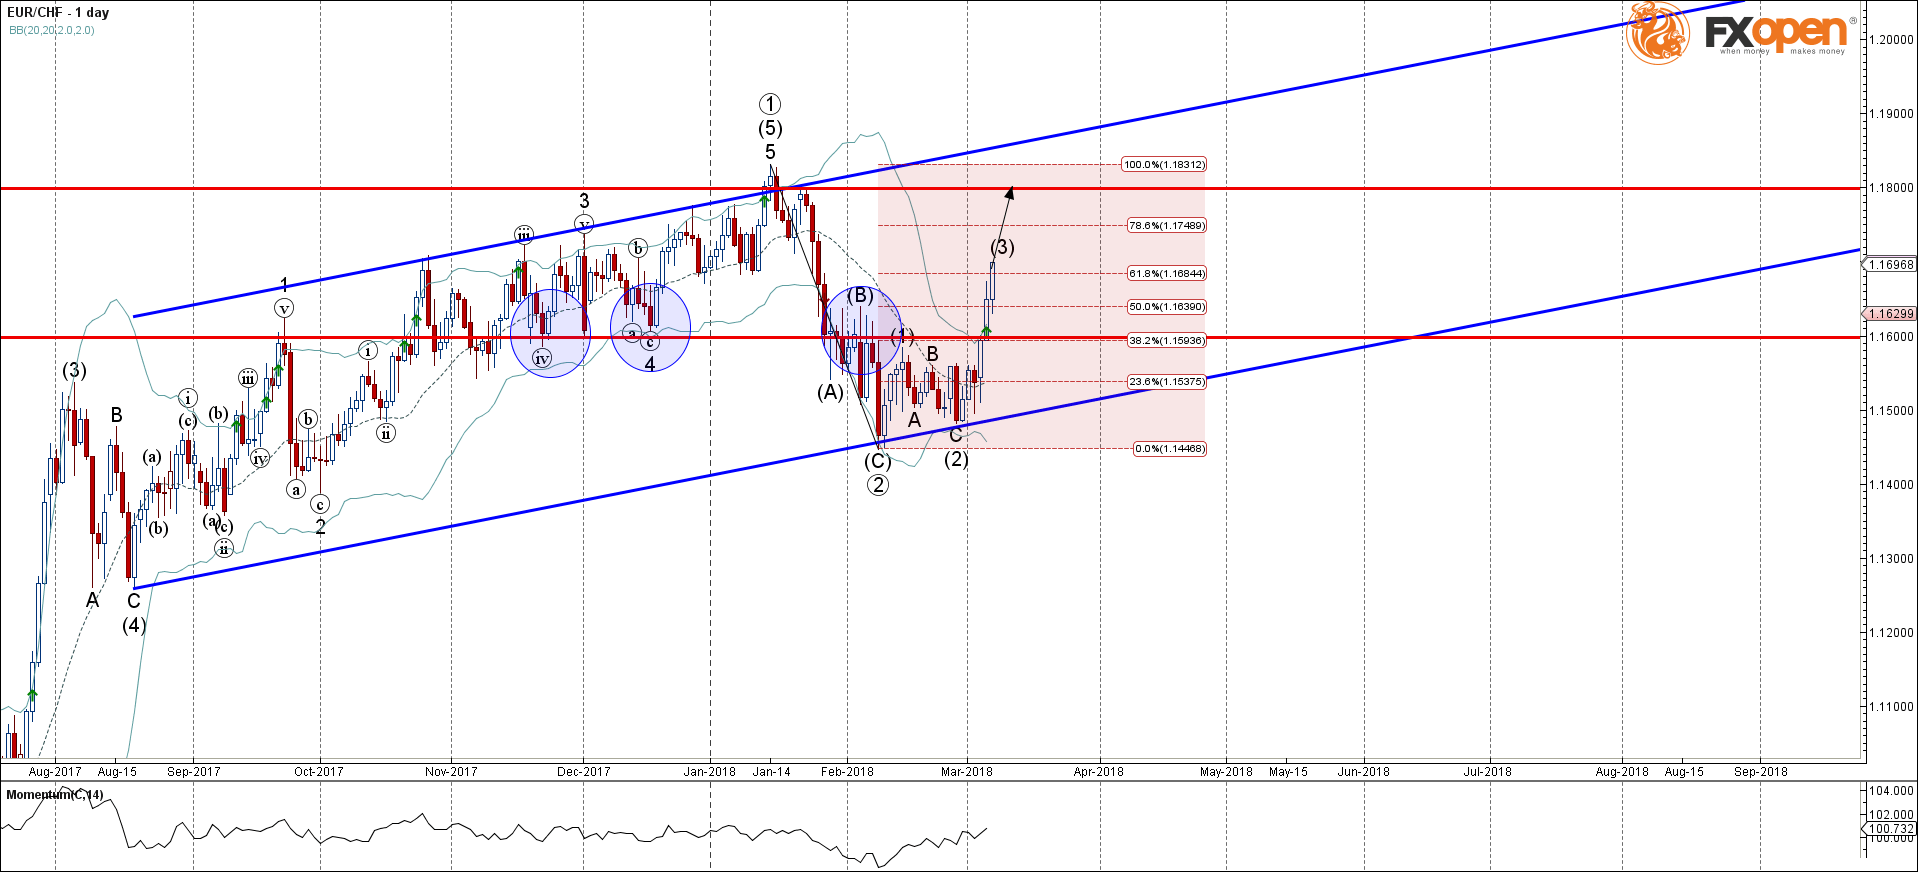
EUR/CHF is expected to continue to rise toward the next buy target at the next strong, multi-month resistance level 1.1800 (which stopped the earlier daily uptrend in the middle of January).
By: Dima Chernovolov
Trade over 50 forex markets 24 hours a day with FXOpen. Take advantage of low commissions, deep liquidity, and spreads from 0.0 pips (additional fees may apply). Open your FXOpen account now or learn more about trading forex with FXOpen.
This article represents the opinion of the Companies operating under the FXOpen brand only. It is not to be construed as an offer, solicitation, or recommendation with respect to products and services provided by the Companies operating under the FXOpen brand, nor is it to be considered financial advice.
Stay ahead of the market!
Subscribe now to our mailing list and receive the latest market news and insights delivered directly to your inbox.


Latest articles

EUR/USD Eyes Gains As USD/CHF Weakness Deepens Again
EUR/USD started a fresh increase above 1.1700 and 1.1720. USD/CHF declined further and is now struggling below 0.7835.
Important Takeaways for EUR/USD and USD/CHF Analysis Today
· The Euro started a decent increase from

Apple: Earnings Day Above the Activity Zone
On 30 April, after the market close, Apple Inc. will release its financial results for the second quarter of fiscal 2026. The consensus forecast, based on estimates from 31 analysts, points to revenue of around $109.7 billion, with expected

USD/JPY and USD/CHF Near Key Levels: The Dollar Supported by the Fed
The US dollar continues to trend upwards following the Federal Reserve meeting, drawing support from the regulator’s moderately hawkish stance and comments by Jerome Powell. Markets interpret the Fed’s rhetoric as a signal that restrictive policy is likely