


EUR/USD and USD/CHF Approaching Crucial Break
FXOpen
EUR/USD recovered recently and moved above the 1.1700 resistance. On the flip side, USD/CHF is in a bearish zone and is struggling to hold a major support at 0.9830.
Important Takeaways for EUR/USD and USD/CHF
- The Euro is approaching a major breakout either above 1.1740 or below 1.1680.
- The EUR/USD pair is placed nicely above the 50 hourly SMA and a bullish trend line with support at 1.1680 on the hourly chart.
- USD/JPY is just holding the 0.9830 support and is currently at a risk of more declines.
- The US ISM Non-Manufacturing Index in May 2018 increased from 56.8 to 58.6.
EUR/USD Technical Analysis
The Euro formed a solid support around 1.1520 and started an upside move against the US Dollar. The EUR/USD pair followed a bullish path and it recently settled above the 1.1700 level.
Looking at the hourly chart, it seems like the pair is struggling to clear the 1.1740 resistance area. The recent swing high was 1.1652 from where the pair bounced sharply and settled above the 50 hourly simple moving average.
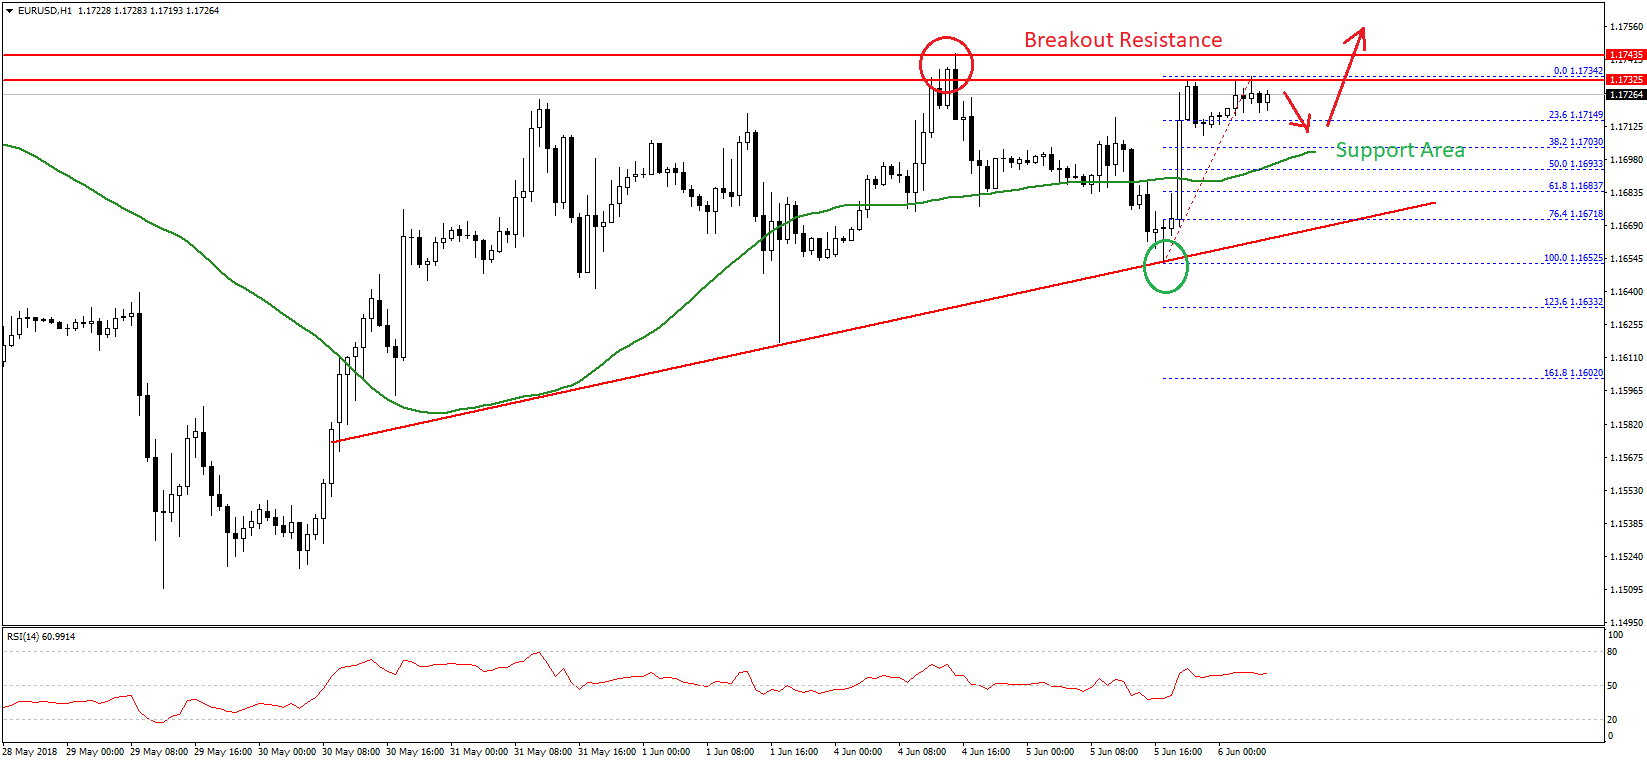
It traded as high as 1.1734 and is currently consolidating losses. An initial support is near the 38.2% Fib retracement level of the last wave from the 1.1652 low to 1.1734 high. However, the most important support is near the 50 hourly SMA at 1.1700.
Moreover, the 50% Fib retracement level of the last wave from the 1.1652 low to 1.1734 high is also at 1.1693 to prevent declines. Lastly, there is a bullish trend line with support near 1.1680 on the same chart.
The overall price structure is positive as long as EUR/USD is above 1.1700. On the upside, a break above the 1.1740 barrier will most likely clear the path for more gains towards 1.1800 in the near term.
USD/CHF Technical Analysis
The US Dollar failed to move past the parity level against the Swiss franc and declined below 0.9980. The USD/CHF pair broke the 0.9950 and 0.9920 support levels and settled below the 0.9880 pivot level.
There was a daily close below the 0.9900 level and the 50 hourly simple moving average. On the downside, the pair is trading near a crucial support at 0.9830, which has prevented declines on many occasions.
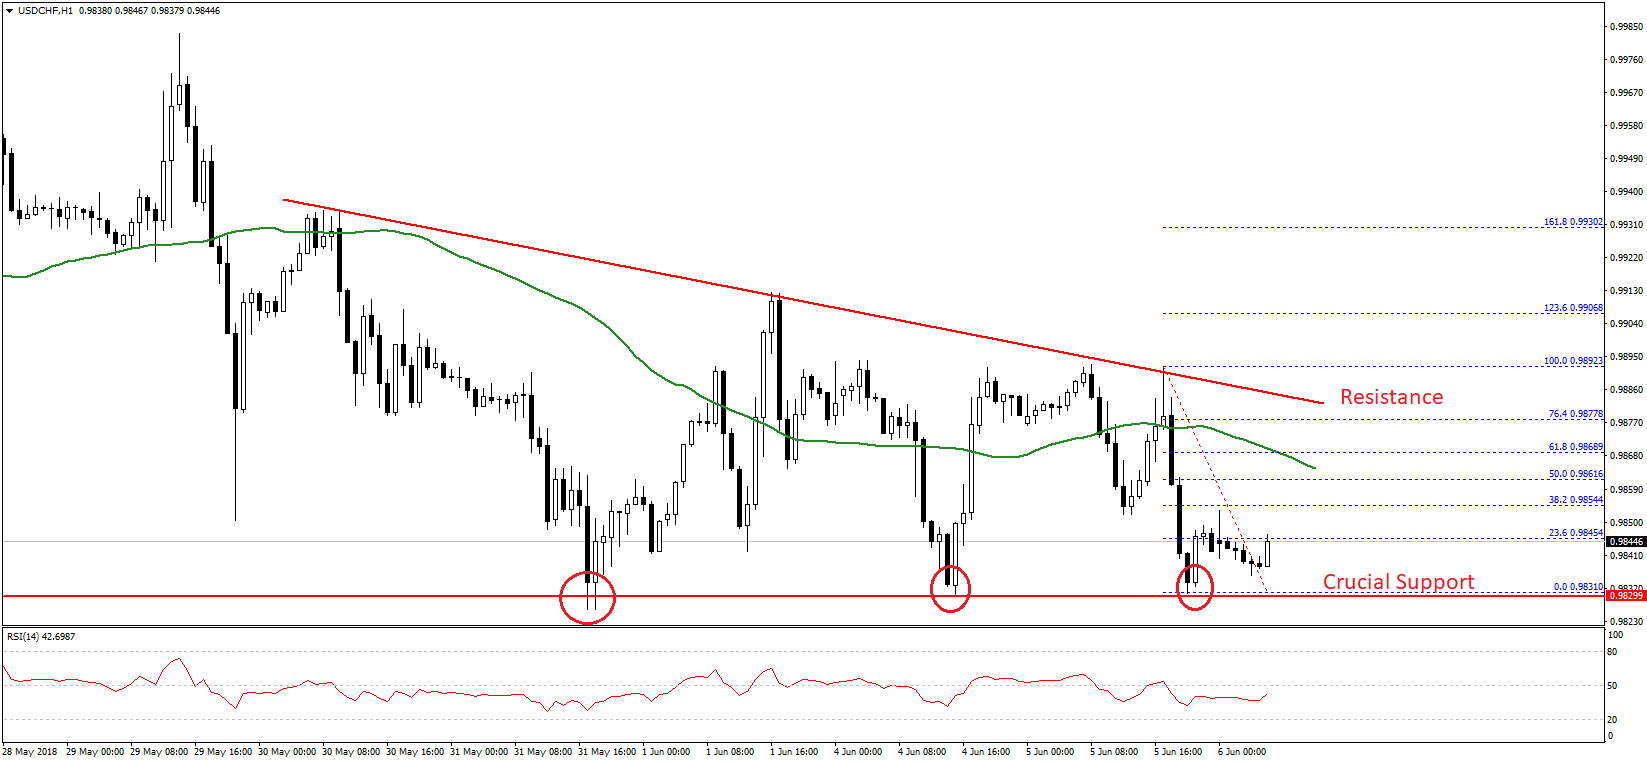
If there is a downside break below 0.9830, there could be heavy losses in USD/CHF. The next key supports are at 0.9800 and 0.9760. On the upside, an initial resistance is at 0.9860, 50 hourly SMA and the 50% Fib retracement level of the last decline from the 0.9892 high to 0.9831 low.
However, there are many barriers on the upside near the 108.80 level. There is also a major bearish trend line with resistance at 108.95 on the hourly chart. Around the trend line, the 50% Fib retracement level of the last decline from the 109.82 high to 108.13 low is at 108.98.
Further above 0.9860, there is also a bearish trend line with current resistance at 0.9880. A proper close above 0.9880 is needed for buyers to take control. On the flip side, a break below 0.9830 may perhaps accelerate declines.
Recently in the US, the ISM Non-Manufacturing Index for May 2018 was released by the Institute for Supply Management (ISM). The market was looking for a rise in the PMI from 56.8 to 57.5.
However, the result was positive as there was an increase in the ISM Non-Manufacturing Index from 56.8 to 58.6. There was no major impact on EUR/USD and the pair seems to be preparing for an upside break above 1.1740.
Trade over 50 forex markets 24 hours a day with FXOpen. Take advantage of low commissions, deep liquidity, and spreads from 0.0 pips (additional fees may apply). Open your FXOpen account now or learn more about trading forex with FXOpen.
This article represents the opinion of the Companies operating under the FXOpen brand only. It is not to be construed as an offer, solicitation, or recommendation with respect to products and services provided by the Companies operating under the FXOpen brand, nor is it to be considered financial advice.
Stay ahead of the market!
Subscribe now to our mailing list and receive the latest market news and insights delivered directly to your inbox.


Latest articles

FTSE 100: Correction Has Ended, but a New Impulse Has Yet to Form
Fundamental backdrop
The UK inflation report for April, published on 20 May, delivered unexpectedly positive figures: annual inflation slowed to 2.8% in April 2026 from 3.3% in March, coming in below the consensus forecast of 3.0% and

Candlestick Wick Analysis in Trading
Candlestick wicks often contain critical information about buying and selling pressure that body patterns alone may not

Market Structure Shift (MSS) in Trading
A Market Structure Shift (MSS) is an ICT trading concept used to identify potential changes