


EUR/USD and USD/JPY Monthly Outlook - Jun 2018
FXOpen
EUR/USD is placed in a major downtrend with supports on the downside at 1.1500 and 1.1400. Major hurdles on the upside are 1.1800 and 1.1950. USD/JPY recovered very well from the 104.60 low and is currently placed in a bullish zone.
Important Takeaways for EUR/USD and USD/JPY
- The Euro settled below a key pivot zone at 1.2000 and 1.1950 against the US Dollar.
- Upsides are likely to be capped by 1.1800 and 1.1950 in EUR/USD.
- USD/JPY has to close above a bearish trend line at 110.80 on the daily chart for more gains.
- Supports on the downside this month are 108.20 and 107.40.
EUR/USD Technical Analysis
The Euro started a major decline in April 2018 from well above 1.2500 against the US Dollar. The EUR/USD pair traded lower and cleared a few crucial supports, including 1.2200 and 1.2000.
During the decline, the pair broke an important bullish trend line with support at 1.2300 on the daily chart. It ignited more slides and pushed the pair in a bearish zone below 1.2000.
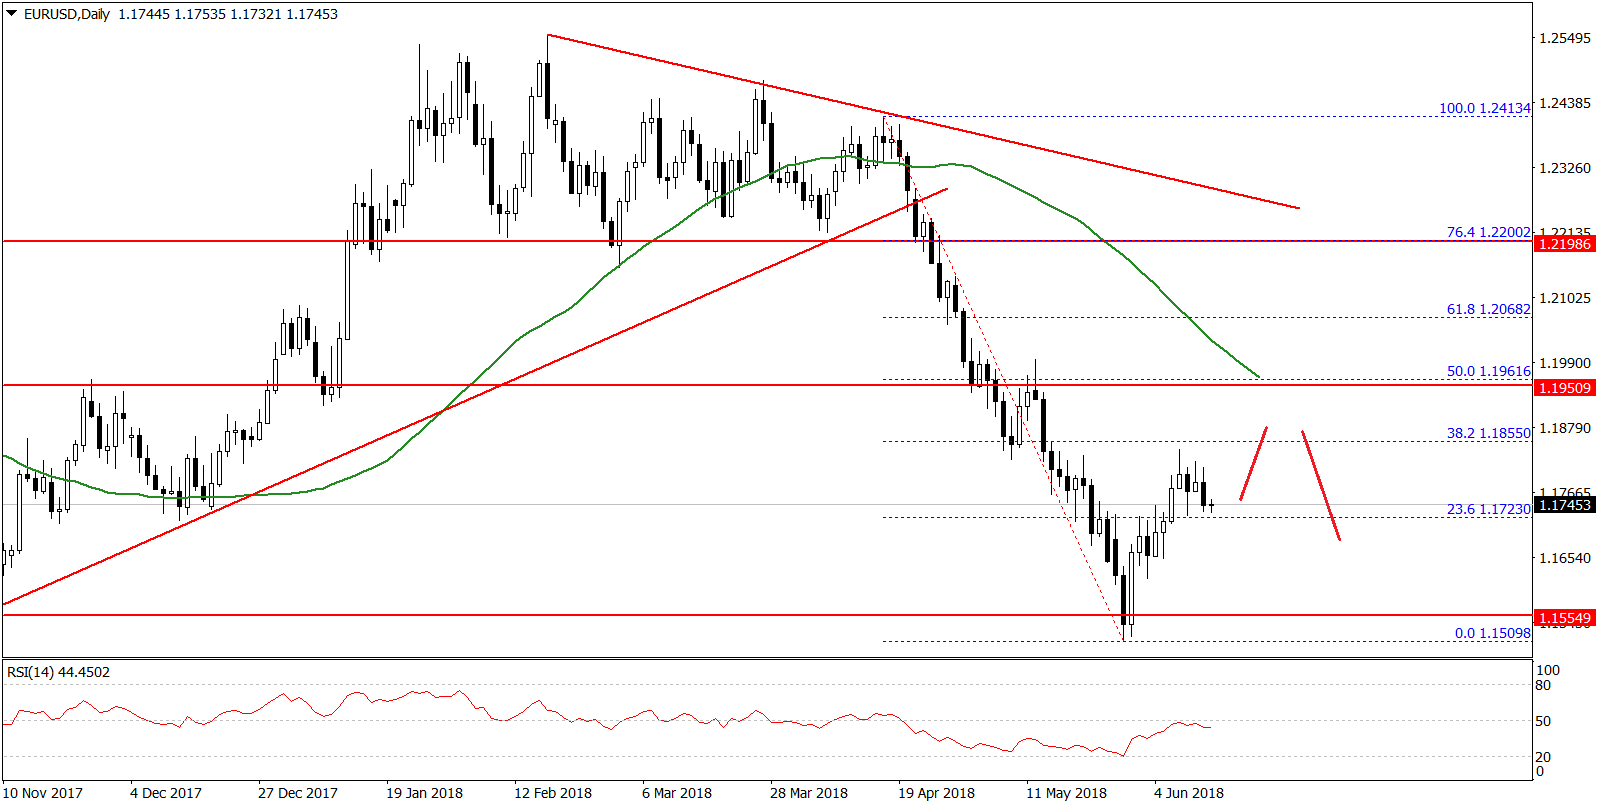
The pair settled below the 1.1950 pivot level and the 50-day simple moving average. The decline was such that the pair broke 76.4% Fib retracement level of the last wave from the 1.1450 swing low to 1.2540 swing high.
It almost tested the 1.1500 support before buyers appeared during late May 2018. The pair started an upside correction from 1.1509 and recovered more than 100 pips.
However, there are many barriers on the upside, starting with the 38.2% Fib retracement level of the last decline from the 1.2413 high to 1.1509 low. However, the most important hurdle this month for buyers is at 1.1950, which was a key support earlier.
Moreover, the 50% Fib retracement level of the last decline from the 1.2413 high to 1.1509 low is also near 1.1950. Therefore, if the pair corrects higher, it may face hurdles near 1.1800, 1.1850 and 1.1950. Only a close above 1.2000 may push the pair back in a bullish zone.
On the downside, the 1.1500 handle holds a lot of importance. A close below it could put a lot of pressure on EUR/USD in the near term.
USD/JPY Technical Analysis
The US Dollar formed a solid support around 104.60 in March 2018 against the Japanese Yen. The USD/JPY pair recovered nicely and moved above the 107.00 resistance.
The upside move was strong as the pair broke the 50% Fib retracement level of the last decline from the 113.68 high to 104.66 low. There was also a close above the 108.00 level and the 50 hourly simple moving average.
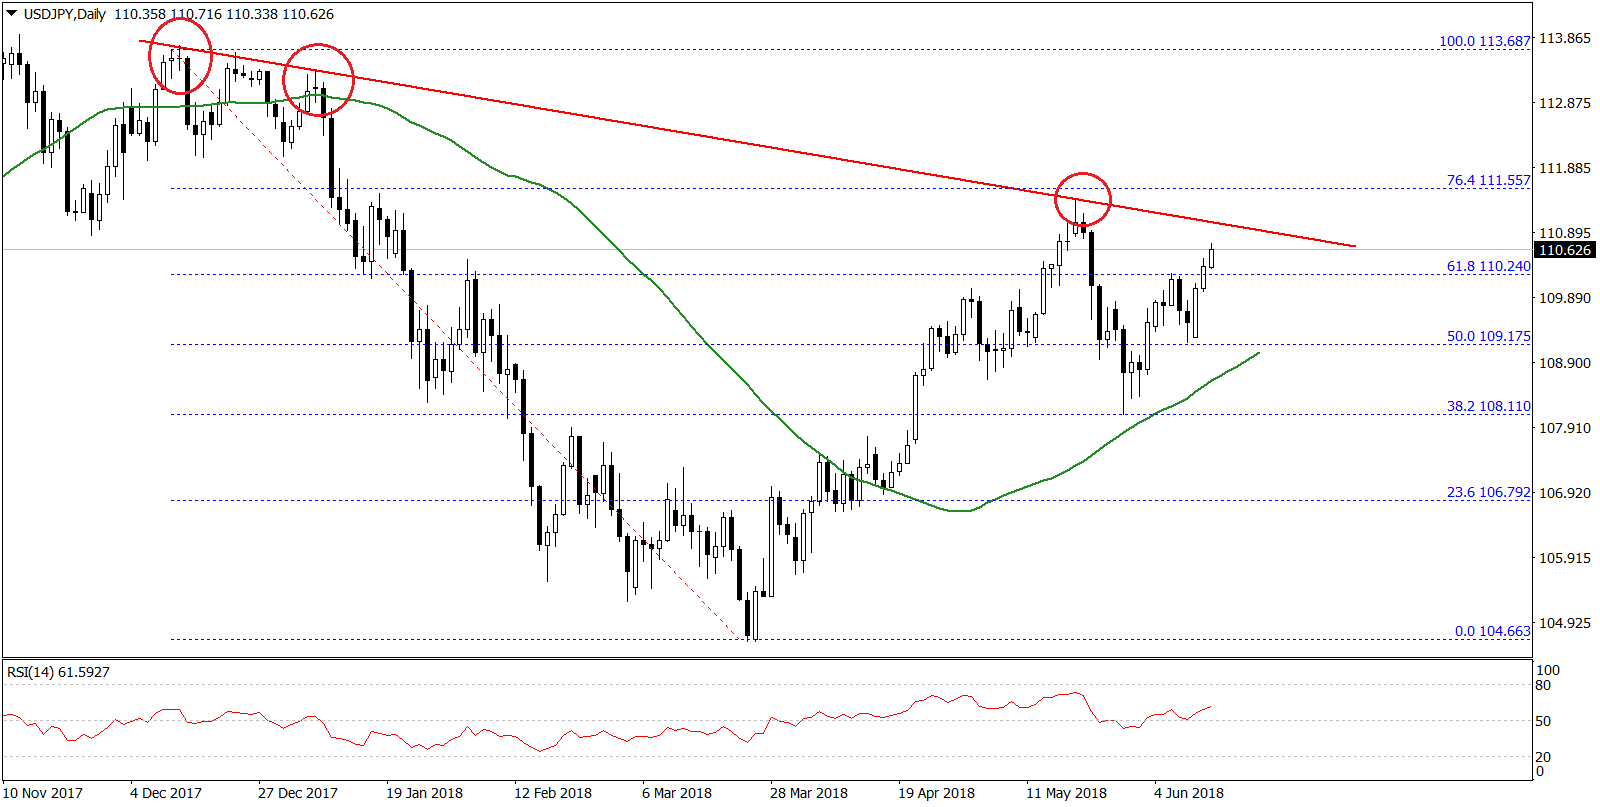
However, there is a major bearish trend line in place with resistance at 110.80 on the daily chart. A break and close above 110.80-111.00 may well open the doors for more gains towards 113.50 this month.
On the flip side, if there is a downside correction, the pair may find support near the 108.20 level. Below this, the next support sits around the 107.40 level.
Trade over 50 forex markets 24 hours a day with FXOpen. Take advantage of low commissions, deep liquidity, and spreads from 0.0 pips (additional fees may apply). Open your FXOpen account now or learn more about trading forex with FXOpen.
This article represents the opinion of the Companies operating under the FXOpen brand only. It is not to be construed as an offer, solicitation, or recommendation with respect to products and services provided by the Companies operating under the FXOpen brand, nor is it to be considered financial advice.
Stay ahead of the market!
Subscribe now to our mailing list and receive the latest market news and insights delivered directly to your inbox.


Latest articles

US Dollar Strengthens Amid Equity Market Weakness and Hawkish Fed Rhetoric
The US dollar continues to hold firm near multi-year highs as sentiment across equity markets deteriorates and investors increasingly expect the Federal Reserve to maintain a restrictive monetary policy stance for longer. The US economy remains resilient, while inflation risks

Bitcoin: Corrective Channel Broken as Traders Turn More Active
Bitcoin has come under the influence of several factors simultaneously. The wave of selling at the beginning of June was linked to Strategy's first disclosed Bitcoin sale in several years, a prolonged series of outflows from spot ETFs, and a

DAX 40: consolidation amid technology sell-off
A wave of selling in the technology sector that emerged earlier this week has weighed on European equities. The trigger was investor concern over the profitability of large-scale debt-funded investments by major US tech companies in AI infrastructure. The Nasdaq